
What does a project export need to become a Gantt chart?
Three columns are enough. Everything else is optional, and each optional column adds something to the chart or to the report.
| Column | Needed? | What it adds |
|---|---|---|
| Task name | Yes | One bar per row |
| Start date | Yes | Where the bar begins |
| End date (or a duration) | Yes | Where the bar ends |
| Phase or group | Optional | Colours the bars by phase |
| % complete | Optional | Fills each bar up to the work done |
| Depends on | Optional | Draws arrows between tasks; the report adds the critical path |
| Owner | Optional | Lets the report show the workload by person |
Column names don't have to match these exactly. You pick which column is which after the upload, and the usual names are recognised on their own.
How do you get the export out of your tool?
Look for "Export" or "Save as" and choose CSV or Excel. The tool's own file format won't work: a Microsoft Project .mpp file, for example, can't be uploaded.
| Your plan lives in | Start here |
|---|---|
| Excel, or Google Sheets downloaded as .xlsx | How to create a Gantt chart |
| A CSV file from any tool | CSV to Gantt chart |
| Jira | Jira export to Gantt chart |
| Microsoft Project | Microsoft Project to Gantt chart |
| Smartsheet | Smartsheet Gantt chart report |
| ServiceNow | ServiceNow Gantt chart report |
| JSON from an API | JSON to Gantt chart |
It isn't only for software projects. A thesis or a long report has a schedule too: see the Gantt chart for report writing. For the other charts a project needs, there's the overview of project management charts.
What does the chart look like?
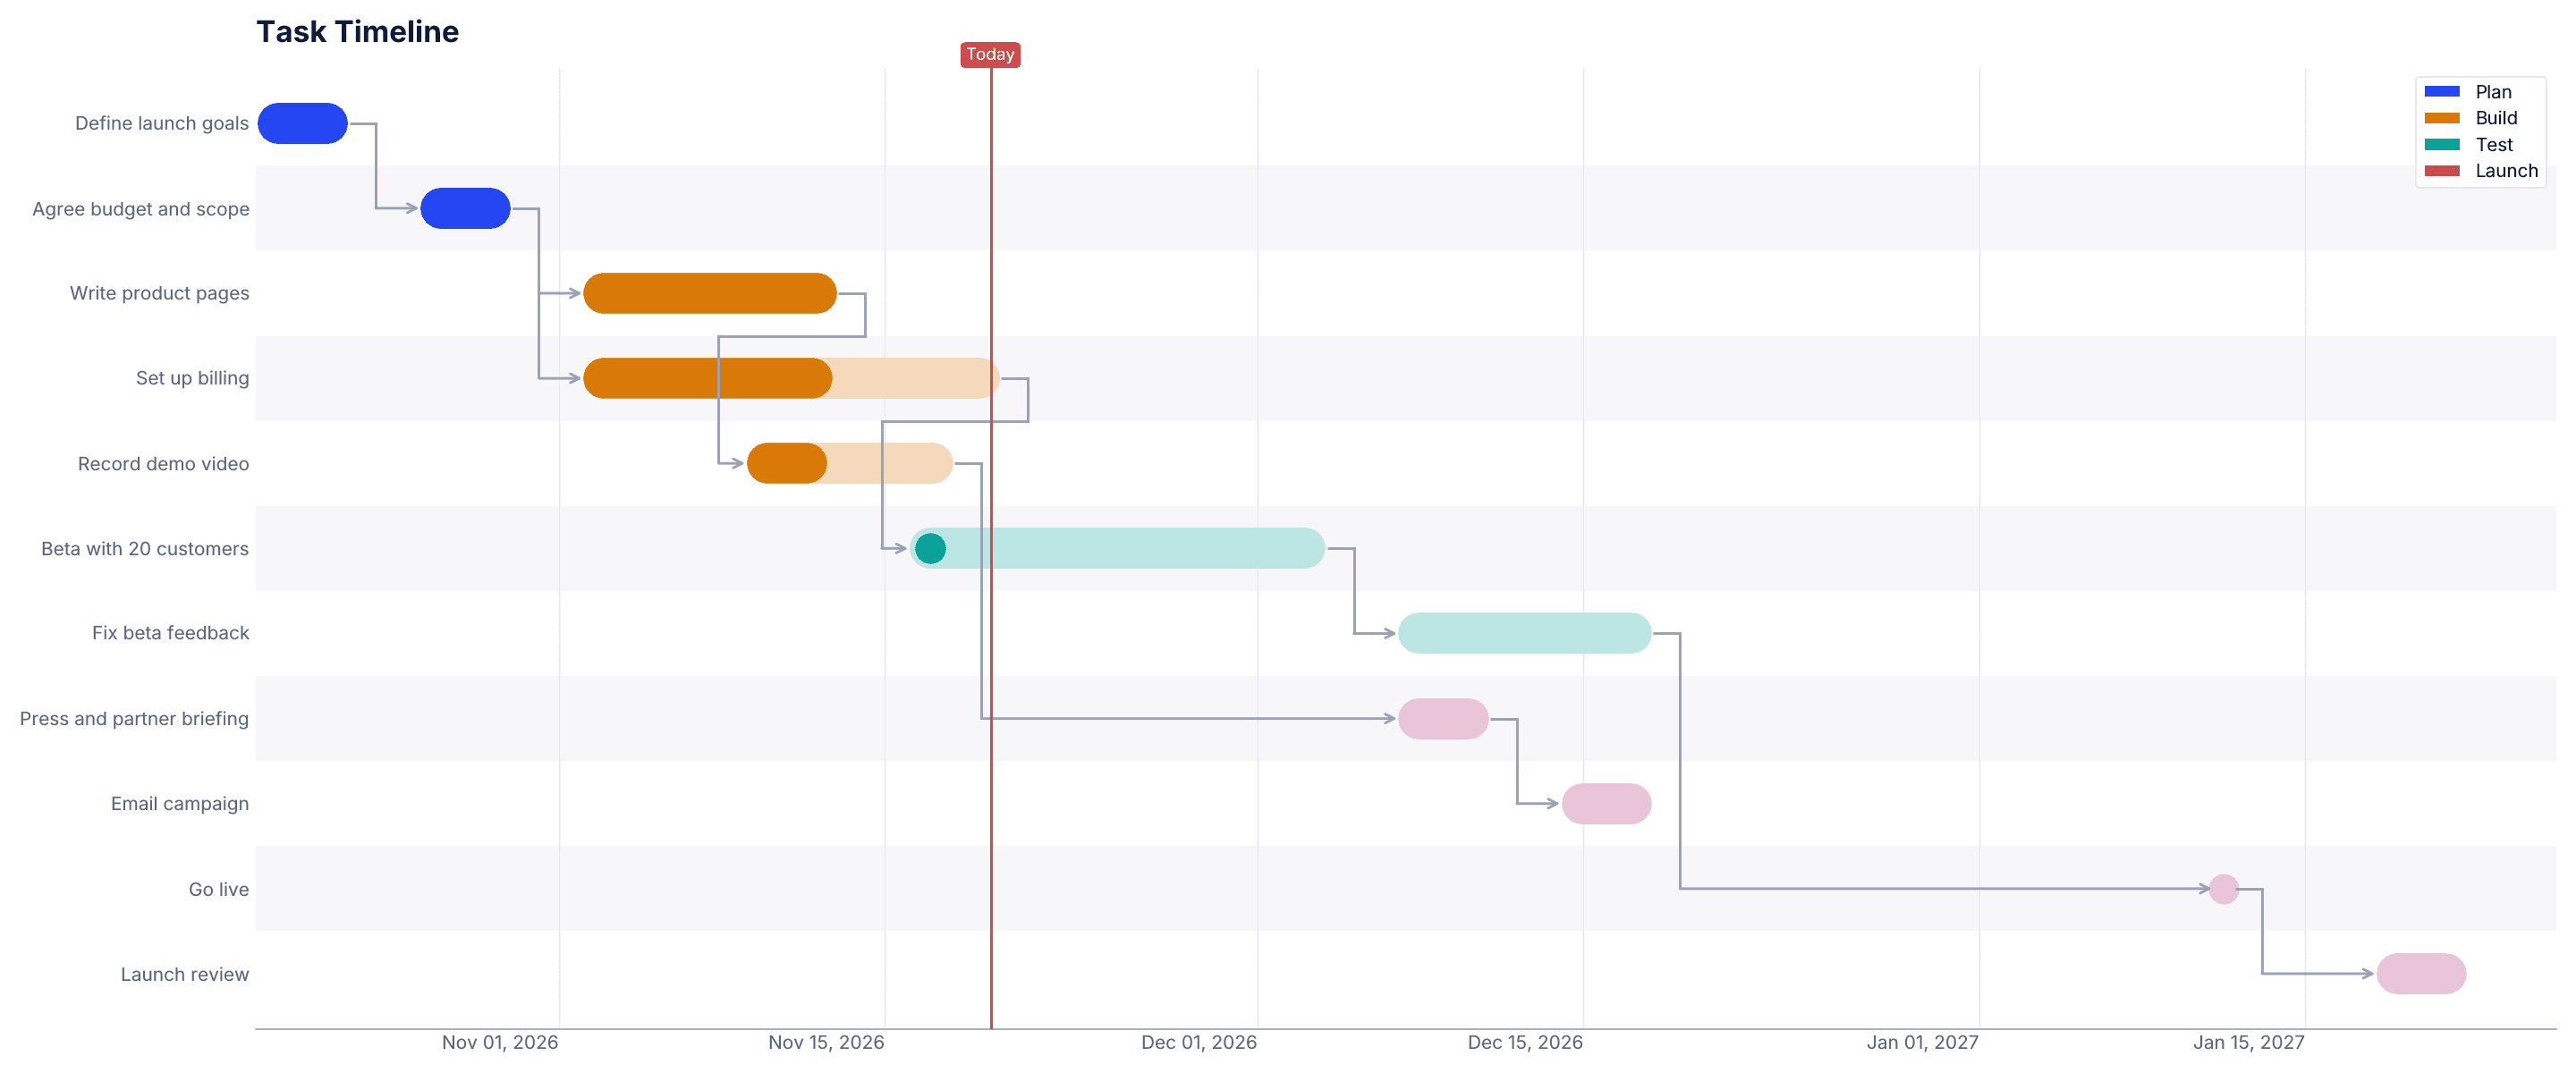
This is a sample launch plan with 11 tasks in four phases, laid out the way a project tool exports it. The darker part of each bar is the work done, the arrows are the dependencies and the red line is today. You can already see one problem: the demo video should be finished and isn't.
What does the same file say as a status report?
A chart shows the plan. A status report says what the plan means today. For the sample file above, CleanChart's report engine returns 9 findings, 3 of them high priority. These four come first:
- At the current pace, the end date slips by about 26 working days. Work is progressing at 73% of the planned pace, so the project would finish around March 1, 2027 instead of January 22.
- The project is 14 points behind plan. 40% of the planned work is done; by today the plan expected 54%.
- 1 task is overdue. The demo video is past its end date and not marked done.
- 2 tasks start before their predecessor is finished. The beta starts 5 working days before billing is set up.
Each finding comes with a recommendation, such as deciding now whether to recover the pace or to move the end date. The report is a PDF with an editable Word file and a PowerPoint deck for the meeting.
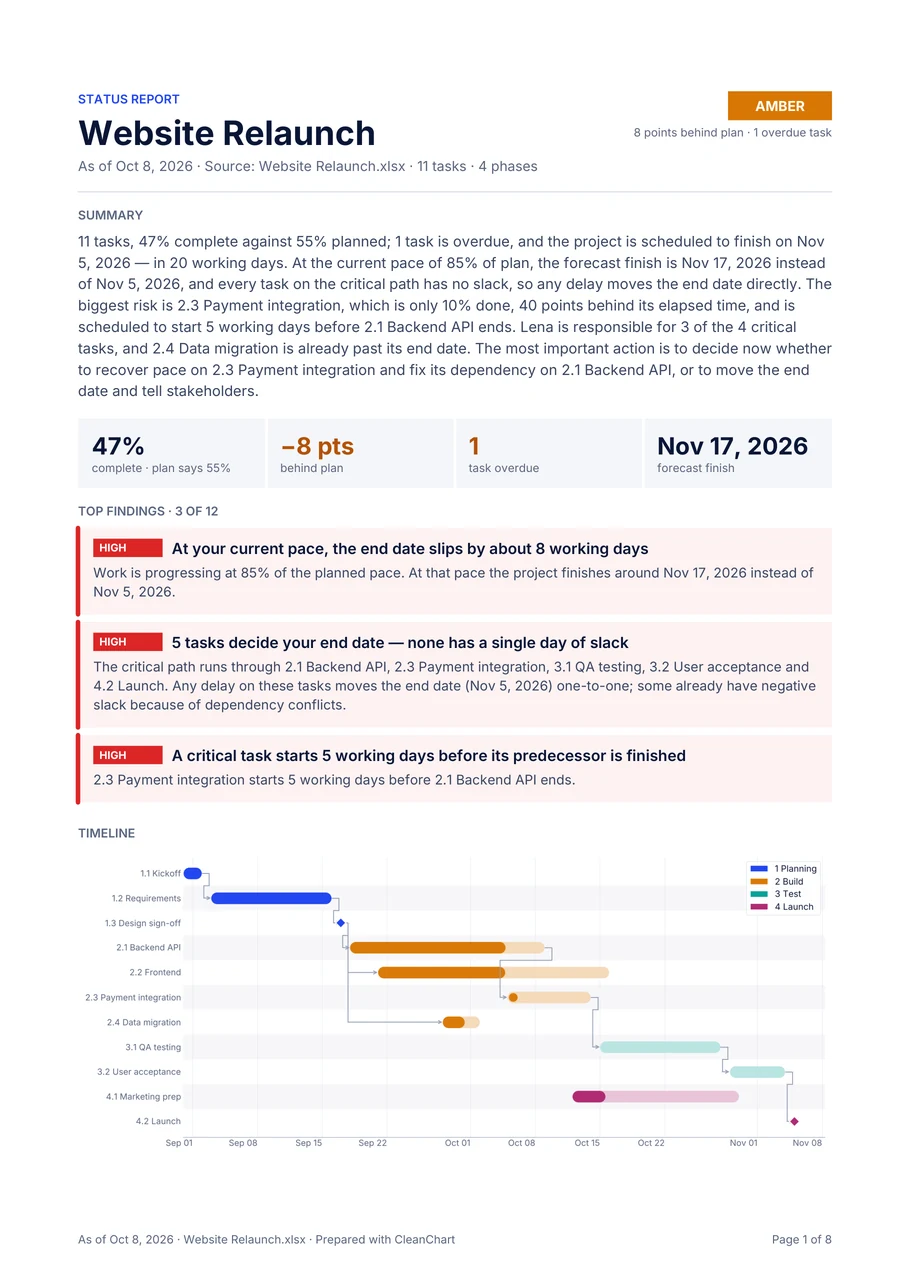
The Gantt chart is free with a small watermark, and so is a preview of page 1 of your own report. The full report comes with the Deadline Pass or Pro. To start from your plan, use the project status report page. Two guides go deeper: the Gantt chart report and the project status report in Excel.
What goes wrong with project exports?
- Relative dates. A plan in "Week 1" or "Sprint 3" has no calendar dates, so it gets no status report. Give every task a real start and end date.
- Summary rows. Many tools export one extra row per phase that spans the whole phase. Keep one row per task and put the phase in its own column.
- Dates without a year. "15/3" can't be placed on a timeline. Export full dates.
- Too few tasks. A short plan still gets its chart, but a status report needs at least 5 tasks with dates and at most 2,000 rows.
- The wrong file. If the upload is refused, it's usually the tool's own format. Export to CSV or Excel instead.
All guides: Project timelines
- ServiceNow Gantt Chart Report: How to Make One
ServiceNow's report designer has no Gantt chart type; the Gantt view lives in the Planning Console and Project Workspace. For a Gantt chart report, take a screenshot of that view, or export the project tasks to Excel or CSV and build the chart and a written status report from the data.
- Smartsheet Gantt Chart Report: How to Make One
To make a Gantt chart report in Smartsheet, create a report with at least two date columns that aren't formula-backed, then switch it to Gantt view from the toolbar. Reports open in the legacy Gantt view only. For a written status report, export the sheet to Excel and analyze the task list.
- Gantt Chart for Report Writing: Sample Schedule
A Gantt chart for report writing is a timeline of every task from agreeing the topic to submitting the report, one bar per task, in the order they depend on each other. Most reports fit five phases: plan, research, draft, review and submit. Schedule the abstract and conclusion late.
- Project Status Report Excel Template (Gantt)
A project status report template in Excel needs seven columns: task, start, end, dependency, percent complete, owner and phase. Only task, start and end are required; the others switch on progress against plan, a forecast finish, the critical path and workload per person.
- Gantt Chart Report: Example and How to Make One
A Gantt chart report is a project report built around the Gantt chart: it shows the schedule, then says what it means. A good one answers four questions on page 1: how far along the project is against plan, which tasks decide the end date, what's late and when it will actually finish.
- CSV to Gantt Chart: A Step-by-Step Guide
A CSV becomes a Gantt chart once it has three columns: a task name, a start date and an end date or a duration. Upload it to a Gantt chart tool and each row becomes a bar on a timeline. Optional group and percent-complete columns add color coding and progress bars.
- JSON to Gantt Chart: A Step-by-Step Guide
A JSON file becomes a Gantt chart when it's a flat array of objects, each with a task name and two dates or a start date plus a duration. If your API wraps the array in an outer object or returns timestamps, pull out the array and convert dates to strings like 2026-09-01 before you upload.
- How to Turn a Jira Export Into a Gantt Chart
To turn Jira issues into a Gantt chart without Advanced Roadmaps, export them as a CSV with a start date and a due date, then upload it to a Gantt chart tool. Use Summary as the task label, a start date field or Created as the start, Due date as the end, and Sprint or Epic to color the bars.
- How to Create a Gantt Chart: Step-by-Step
To create a Gantt chart, list one task per row with a task name, a start date and an end date or duration. Each task becomes a horizontal bar on a timeline, so overlapping and dependent work is easy to see. Optional columns like phase, owner or progress let you color-code the bars and track status.
- Project Management Pie Charts: When to Use Them (and Better Alternatives)
A pie chart works for project data when one total splits into five categories or fewer, like a budget by department or a backlog by status. Past five or six slices, the wedges get too close in size to compare by eye. Then a bar chart, stacked bar chart or treemap shows the same numbers more clearly.
- Project Management Pie Chart & Gantt Guide
Use a Gantt chart for project timelines and task dependencies, and bullet or gauge charts to compare KPIs like budget or completion with a target. Funnel charts show where work gets stuck, and grouped or stacked bars compare teams or sprints. Keep a project dashboard to 5 to 7 charts.
Frequently Asked Questions
Can I upload a Microsoft Project (.mpp) file?
No. Export the tasks to Excel or CSV in Microsoft Project first and upload that file.
Do I need an account to make the Gantt chart?
No. Upload the export and the chart is drawn. The free download carries a small watermark.
What does the status report cost?
The preview of page 1 is free. The full report as PDF, Word and PowerPoint comes with the Deadline Pass ($4.99 for 24 hours) or Pro ($19 a month).
How big can the export be?
Up to 2 MB per upload. A status report needs between 5 tasks and 2,000 rows, and the tasks need calendar dates.