
ServiceNow has no Gantt chart report type. The Gantt chart lives in Project Portfolio Management: the Planning Console and the planning page of Project Workspace draw your project tasks on a timeline with their dependencies, but the report designer can't build one. So a "ServiceNow Gantt chart report" usually means one of two things: a picture of the Gantt view for a slide, or a written status report built from the project's task data. For the second, you export the project tasks to Excel or CSV and analyze them outside ServiceNow. Below are both routes, with a worked example from a 14-task sample export.
We make CleanChart, so weigh our ranking accordingly. The ServiceNow steps below come from ServiceNow's own documentation and work without any other tool.
Can You Make a Gantt Chart Report in ServiceNow?
Not in the report designer. Asked on the ServiceNow Community whether a Gantt chart can be made in reports, the accepted answer was: "The short answer is no. Gant charts are not part of the report designer." Where ServiceNow does draw a Gantt chart:
- Planning Console. ServiceNow's Gantt chart documentation describes it as "a visual representation of a project timeline" that "shows start and end dates of tasks, and the dependencies between tasks."
- Project Workspace. The planning page has a Gantt view button, which per the Project Workspace documentation "Displays data in Gantt view on planning page." Project Workspace can also generate a status report and export it as a PowerPoint file.
- UI Builder or store apps. Teams that need a Gantt chart on a dashboard build a custom component or install an app. That's development work, not a report.
Printing or exporting the Gantt view itself is where most people get stuck. Asked in November 2025 whether the planning Gantt chart can be exported to PowerPoint or Excel from Project Workspace, a ServiceNow Community reply said "there is no out-of-the-box feature that directly exports the Gantt chart view to PowerPoint (PPT) or Excel formats." The suggested workarounds were a screenshot, or exporting the task data and building the chart from it. The rest of this guide is about doing the second one properly.
How Do You Export a ServiceNow Project for a Gantt Chart?
There are three exports, and they don't carry the same columns:
| Export | Where | What you get |
|---|---|---|
| List export (Excel or CSV) | Right-click a column header in the project task list, then Export | The project tasks as rows, with the columns you choose for the list |
| Planning Console CSV | Planning Console | The tasks with "Only the columns which are visible in the Planning Console" |
| Microsoft Project (MPP or XML) | Export module, Project form or Planning Console | The plan as a Project file, for moving it into Microsoft Project |
The steps for the list export are in ServiceNow's Export data from a list article. The Planning Console and Microsoft Project options are in the Export project data article, which also notes that the project must use the Project Management Schedule or the Default MS Project schedule before it can be exported.
For a status report you want these columns in the export: the task name (Short description), Planned start date, Planned end date, Percent complete, State and Assigned to. Dependencies are the tricky one. ServiceNow stores them in their own table: the task dependency documentation says "Project task dependencies are saved on the Planned Task Relationship [planned_task_rel_planned_task] table." So check your file after exporting. If it has no predecessor column, you'll get a plan and status review without a critical path, or you add the column yourself (step 2 below).
What Does a Written Report From a ServiceNow Export Show?
To show what a written report adds, we built a sample task list shaped like a ServiceNow project task export: an HR service portal rollout with 14 tasks, the column names ServiceNow uses (Number, Short description, Planned start date, Planned end date, Planned duration, Percent complete, State, Assigned to), dates with times as ServiceNow writes them, and a Predecessors column added by hand. Everything in it is sample data, and the status date is 18 November 2026. You can download the sample export (CSV) and try it yourself.
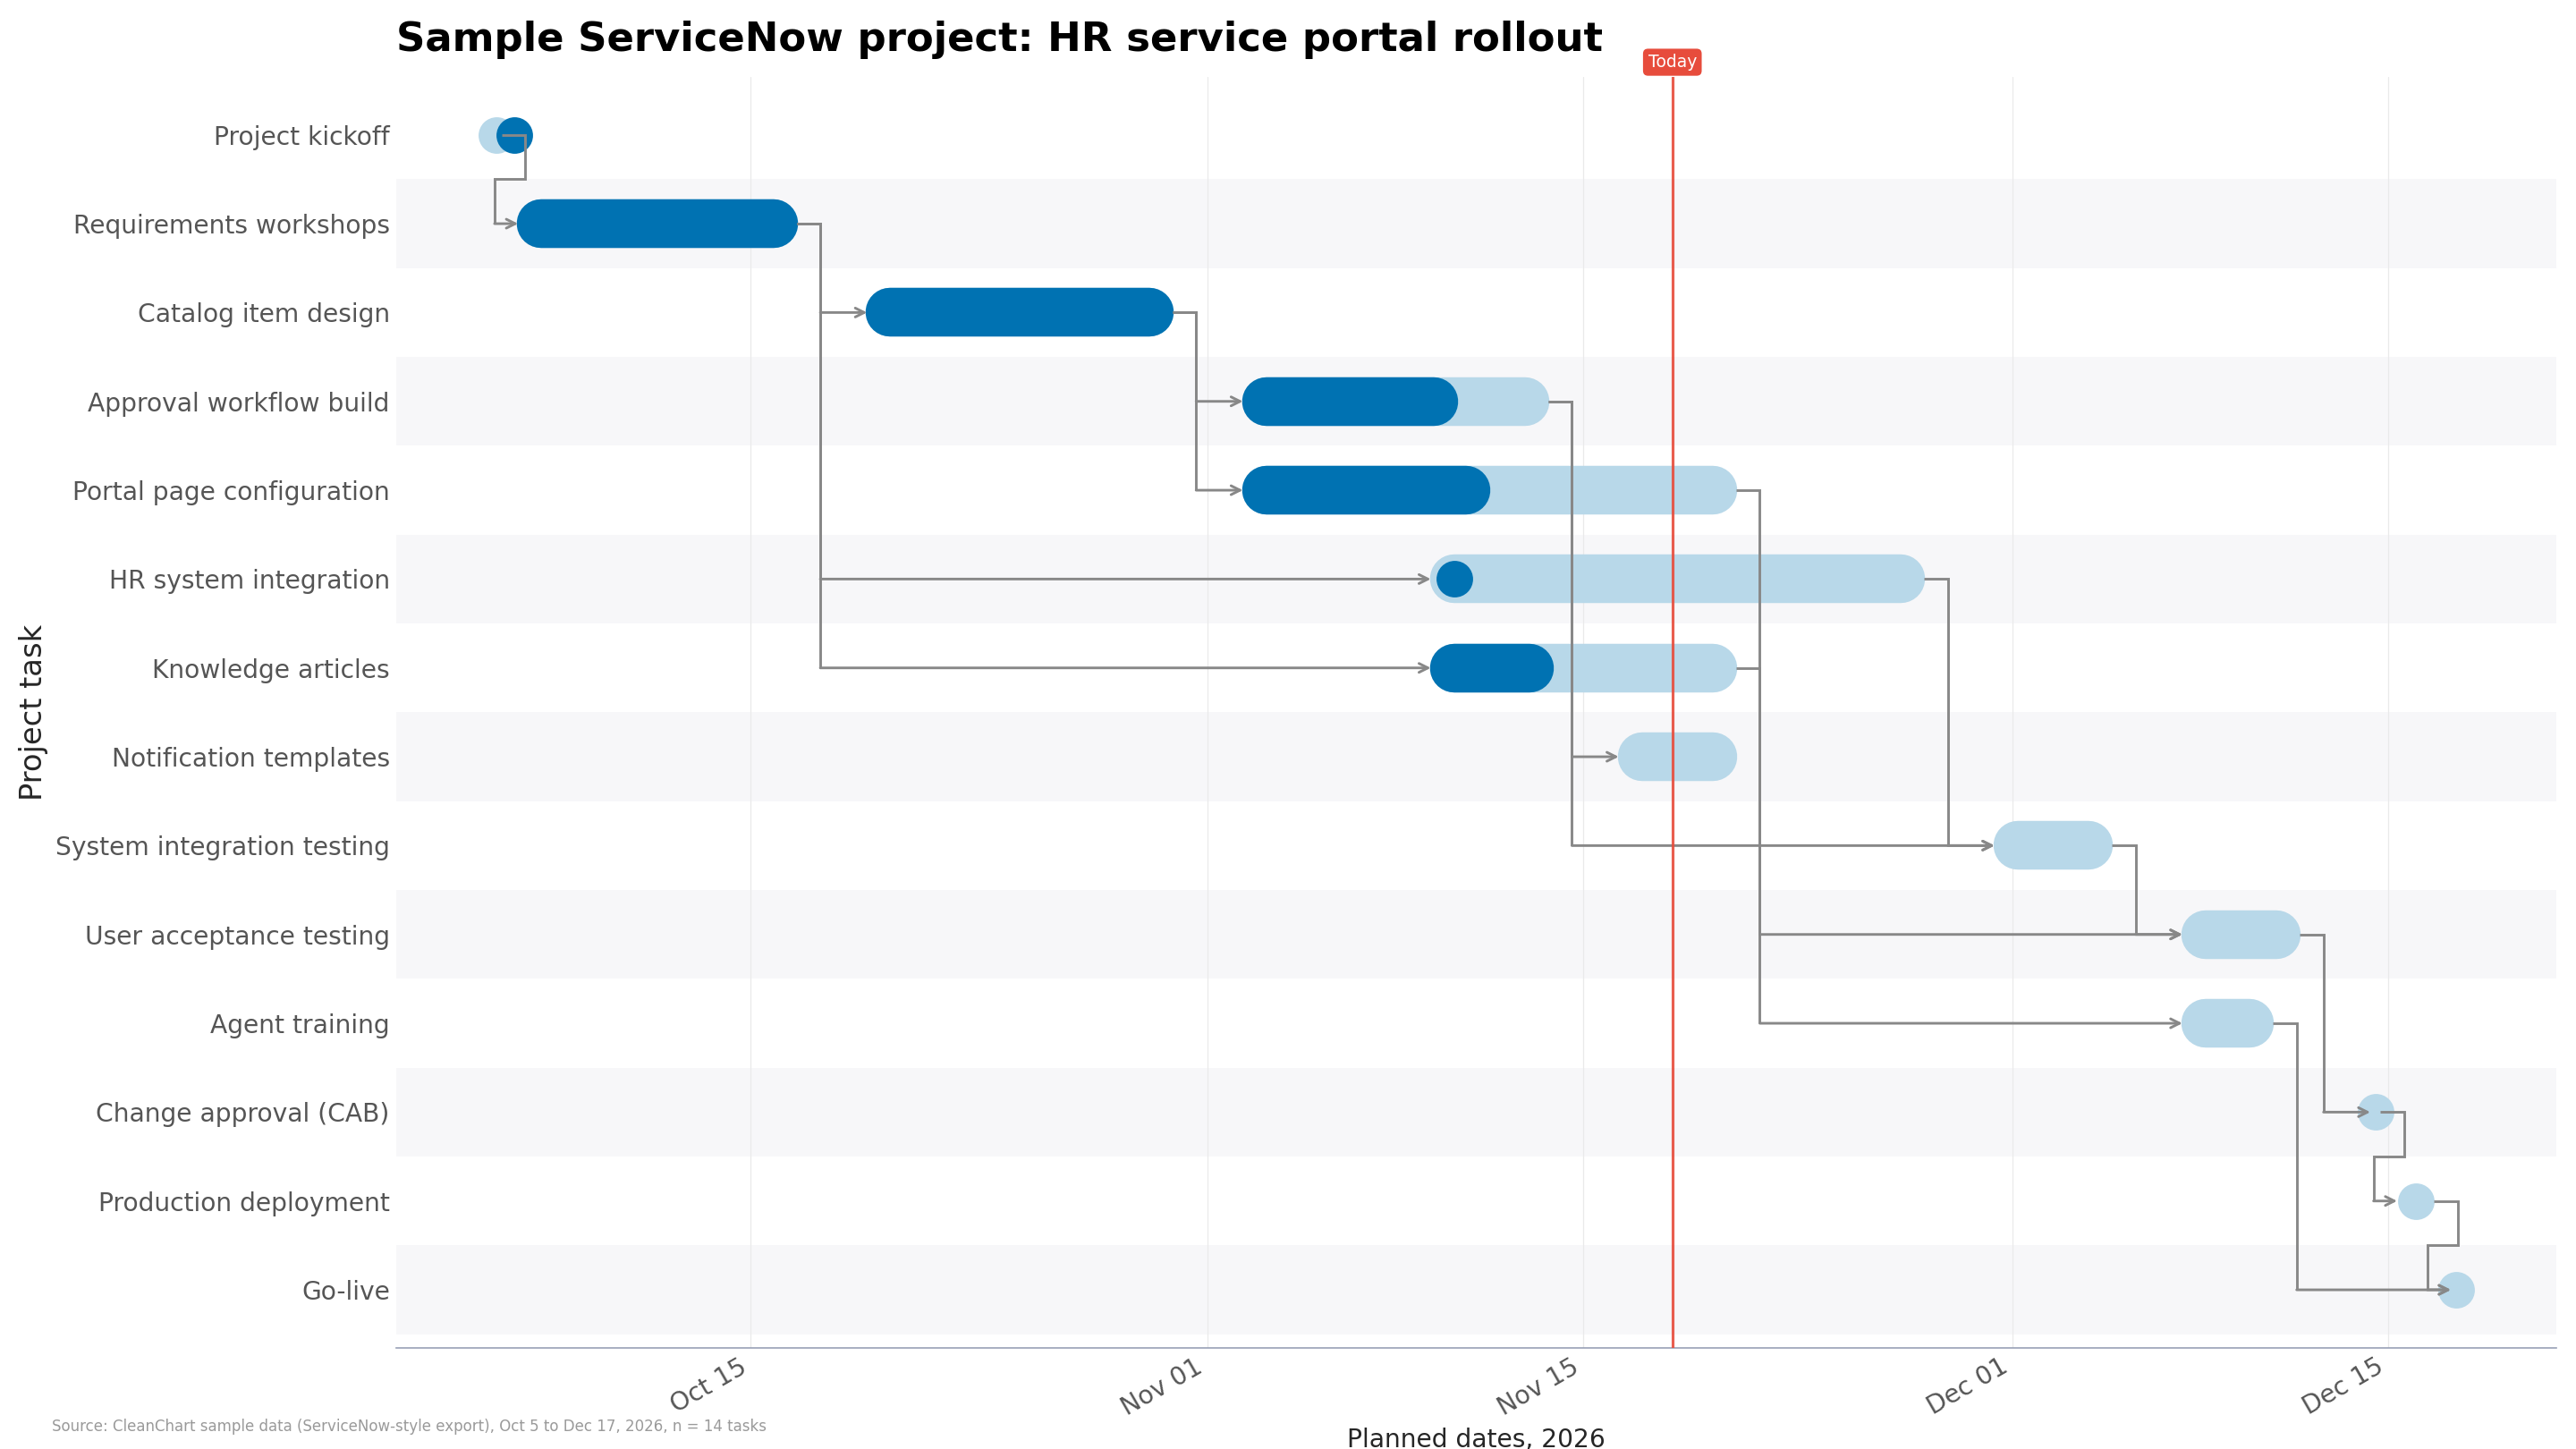
The chart looks busy but not alarming: a few bars running long, the rest ahead of the today line. We then ran the same rows through CleanChart's project report engine. It rated the project Red ("24 points behind plan, 1 overdue task") and returned 11 findings. The page-1 figures:
- 43% complete where the plan expected 68% by the status date, so 24 points behind.
- 1 task overdue: Approval workflow build is past its end date of 13 November and not marked done.
- Forecast finish Jan 28, 2027 instead of the planned Dec 17, 2026.
The four findings rated high, quoted as the engine returned them:
- "At your current pace, the end date slips by about 30 working days." Work is progressing at 64% of the planned pace.
- "6 tasks decide your end date — none has a single day of slack." The critical path runs through HR system integration, System integration testing, User acceptance testing, Change approval (CAB), Production deployment and Go-live.
- "1 task on the critical path is behind plan by up to 43 points." HR system integration is 10% done, 43 points behind its elapsed time.
- "The project is 24 points behind plan."
The critical path is the useful surprise here. On the chart, the overdue Approval workflow build looks like the problem. The engine points at HR system integration instead: it isn't overdue yet, but it has no slack and is far behind. The medium findings fill in the rest. Notification templates should have started and shows no progress. One person has 3 tasks running in the week of Nov 16. Marcus Lee owns 2 of the 4 critical tasks (the engine reads Change approval (CAB) and Go-live, which start and end on the same day, as milestones and leaves them out). Agent training is 4 working days of slack away from becoming critical. And Go-live follows Production deployment with 0 working days of buffer, which is tight for a change that needs CAB approval first.
We also ran the file without the Predecessors column, the way a plain list export often arrives. The report still came back Red with the same percent behind plan, overdue task and forecast, but with 8 findings instead of 11: no critical path, no "behind plan on the critical path" warning and no slack figures. The dependency column is what turns a progress check into a report about the end date.
For the full layout of such a report (one-page brief, critical path page, workload, appendix) see the 8-page sample project report (PDF), made from a different sample plan.
How Do You Turn the Export Into a Status Report?
- Export the project tasks to Excel. Open the project task list filtered to your project, add the columns listed above with Configure List, then right-click a column header and choose Export, then Excel (.xlsx). Excel keeps the dates as dates, which saves a cleanup step.
- Add the dependencies if you need a critical path. Add a Predecessors column and type the name of the task (or tasks, separated by semicolons) that must finish first. If you'd rather use task numbers such as PRJTASK0010236, rename the Number column to ID. In our test, predecessors written as PRJTASK numbers next to a column still called Number matched nothing: the report listed "16 dependency references could not be matched to a task" and had no critical path. With the column renamed to ID, all 11 findings came back.
- Keep Percent complete. ServiceNow's State values Closed Complete and Work in Progress aren't among the status words the report engine recognizes, so in our test 7 of them were listed in the data notes as unknown. Progress came from Percent complete, so the numbers above were unaffected. If your export has State but no Percent complete, add the column before exporting.
- Upload the file to the Excel to Gantt chart converter and check the column mapping: Short description as the task, Planned start date and Planned end date as the dates, and Predecessors as the dependency column. Percent complete feeds the status section, and Assigned to adds workload by person.
- Open the report preview. It shows your own numbers before you pay: the number of findings, the key figures and the top finding in full.
- Get the report. Reports are included in the Deadline Pass ($4.99 for 7 days) and in Pro ($19 a month). You download a PDF and the same report as an editable Word file (.docx) and a PowerPoint deck (.pptx), which can sit next to the status report deck Project Workspace exports. The Gantt chart itself stays free with a watermark.
The limits: at least 5 tasks with calendar dates and no more than 2,000 rows. Predecessors with a type or lag are treated as finish-to-start and listed in the data notes, so a ServiceNow plan that relies on start-to-start links or lag will read slightly differently. The page-1 summary is written by the Claude API from the computed findings, never from your raw rows, and owner names are replaced with placeholders before that call.
Which Route Should You Use?
| Gantt view in ServiceNow | Screenshot or Project Workspace status report | CleanChart project report | |
|---|---|---|---|
| Stays current | Yes, live in the instance | No, a snapshot | No, upload a new export each time |
| Who can read it | People with access to the project | Anyone you send it to | Anyone you send it to |
| Written analysis | No | What you type into the status report | Yes: ranked findings, recommendations and a summary |
| Forecast finish and % behind plan | No | No | Yes, when the file has Percent complete or a status column |
| Critical path | Shown in the Planning Console | Only if it's in the screenshot | Yes, when the file has a dependency column |
| Limits | Needs Project Portfolio Management | No built-in export of the Gantt view itself | 5 to 2,000 rows, calendar dates; PDF, Word and PowerPoint in English |
| Cost | Part of your ServiceNow licence | Part of your ServiceNow licence | Deadline Pass or Pro; preview free |
If everyone who needs the plan works in ServiceNow, keep them in the Planning Console or Project Workspace: it never goes stale and it's where the changes get made. If a steering group, a client or a sponsor wants a document that says where the project stands and what to decide, a snapshot with written findings serves them better. That's the gap the export route fills, and it's also the one place where a third-party tool earns its keep over ServiceNow's own views.
Frequently Asked Questions
Can I create a Gantt chart in the ServiceNow report designer?
No. Gantt charts aren't a report type. The built-in Gantt chart is part of Project Portfolio Management, in the Planning Console and on the planning page of Project Workspace.
How do I export a Gantt chart from ServiceNow?
There's no built-in export of the Gantt view as an image, PowerPoint or Excel chart. Export the project tasks to Excel or CSV instead, or export the project to Microsoft Project, and build the chart from that file.
Why are there no predecessors in my ServiceNow export?
ServiceNow keeps task dependencies in a separate table (Planned Task Relationship), so a task export may not include them. Add a Predecessors column with the names of the tasks that must finish first, or with their numbers and the Number column renamed to ID.
Does the report read ServiceNow's State column?
Partly. Open is recognized, but Closed Complete and Work in Progress aren't, and the report lists them as unknown status values. Include Percent complete in the export and progress is read from that.
Is the report free?
No. The preview is free and shows your own key figures and top finding. The full report (PDF, Word and PowerPoint) is included in the Deadline Pass ($4.99 for 7 days) and in Pro ($19 a month).
Related CleanChart Resources
Tools
- Excel to Gantt Chart Converter – Upload the ServiceNow export and open the report preview
- CSV to Gantt Chart Converter – The same for a CSV export
- Gantt Chart Maker – Build the chart from any task list
- How CleanChart reports work – Project and data reports side by side
Related Blog Posts
- Gantt Chart Report: Example and How to Make One – What a Gantt chart report should contain, page by page
- Smartsheet Gantt Chart Report: How to Make One – The same export route for Smartsheet
- How to Turn a Jira Export Into a Gantt Chart – The same route for Jira
External Resources
- ServiceNow Docs: Gantt chart – The Planning Console Gantt chart
- ServiceNow Docs: Export project data – Microsoft Project, XML and CSV exports
- ServiceNow Docs: Modify a project task dependency – Where dependencies are stored