A project status report in Excel needs one table with seven columns: task, start, end, dependency, percent complete, owner and phase. From those, a status report answers three questions: how far along is the project against plan, what is late, and when will it actually finish. Download the template (CSV, opens in Excel), fill in your tasks and you have the input. Below is a worked example with 13 tasks, and what a report built from it says.
We make CleanChart, so weigh our ranking accordingly. The template works in any tool; the later sections say where Excel alone is enough and where it isn't.
Which columns does a status report template need?
Seven columns cover a status report. Only the first three are required for a plan; the rest switch on the status parts.
| Column | Example value | What it unlocks |
|---|---|---|
| Task | 2.2 Furniture delivery | One row per task; the name appears in findings |
| Start, End | 2026-10-12, 2026-10-30 | The schedule and the overdue check. Use calendar dates, not "Week 1" |
| Depends | 1.3 Floor plan and seating | The critical path and dependency conflicts |
| Progress | 70 | Percent complete against plan, variance and a forecast finish |
| Owner | Omar | Workload and key-person risk per person |
| Phase | 2 Set up | Progress per phase and phase overlap |
Keep one task per row, write dependencies as the exact name of the predecessor, and store progress as a plain number from 0 to 100. Those three habits prevent most broken status reports.
Example: a 13-task office move, reported on 4 November 2026
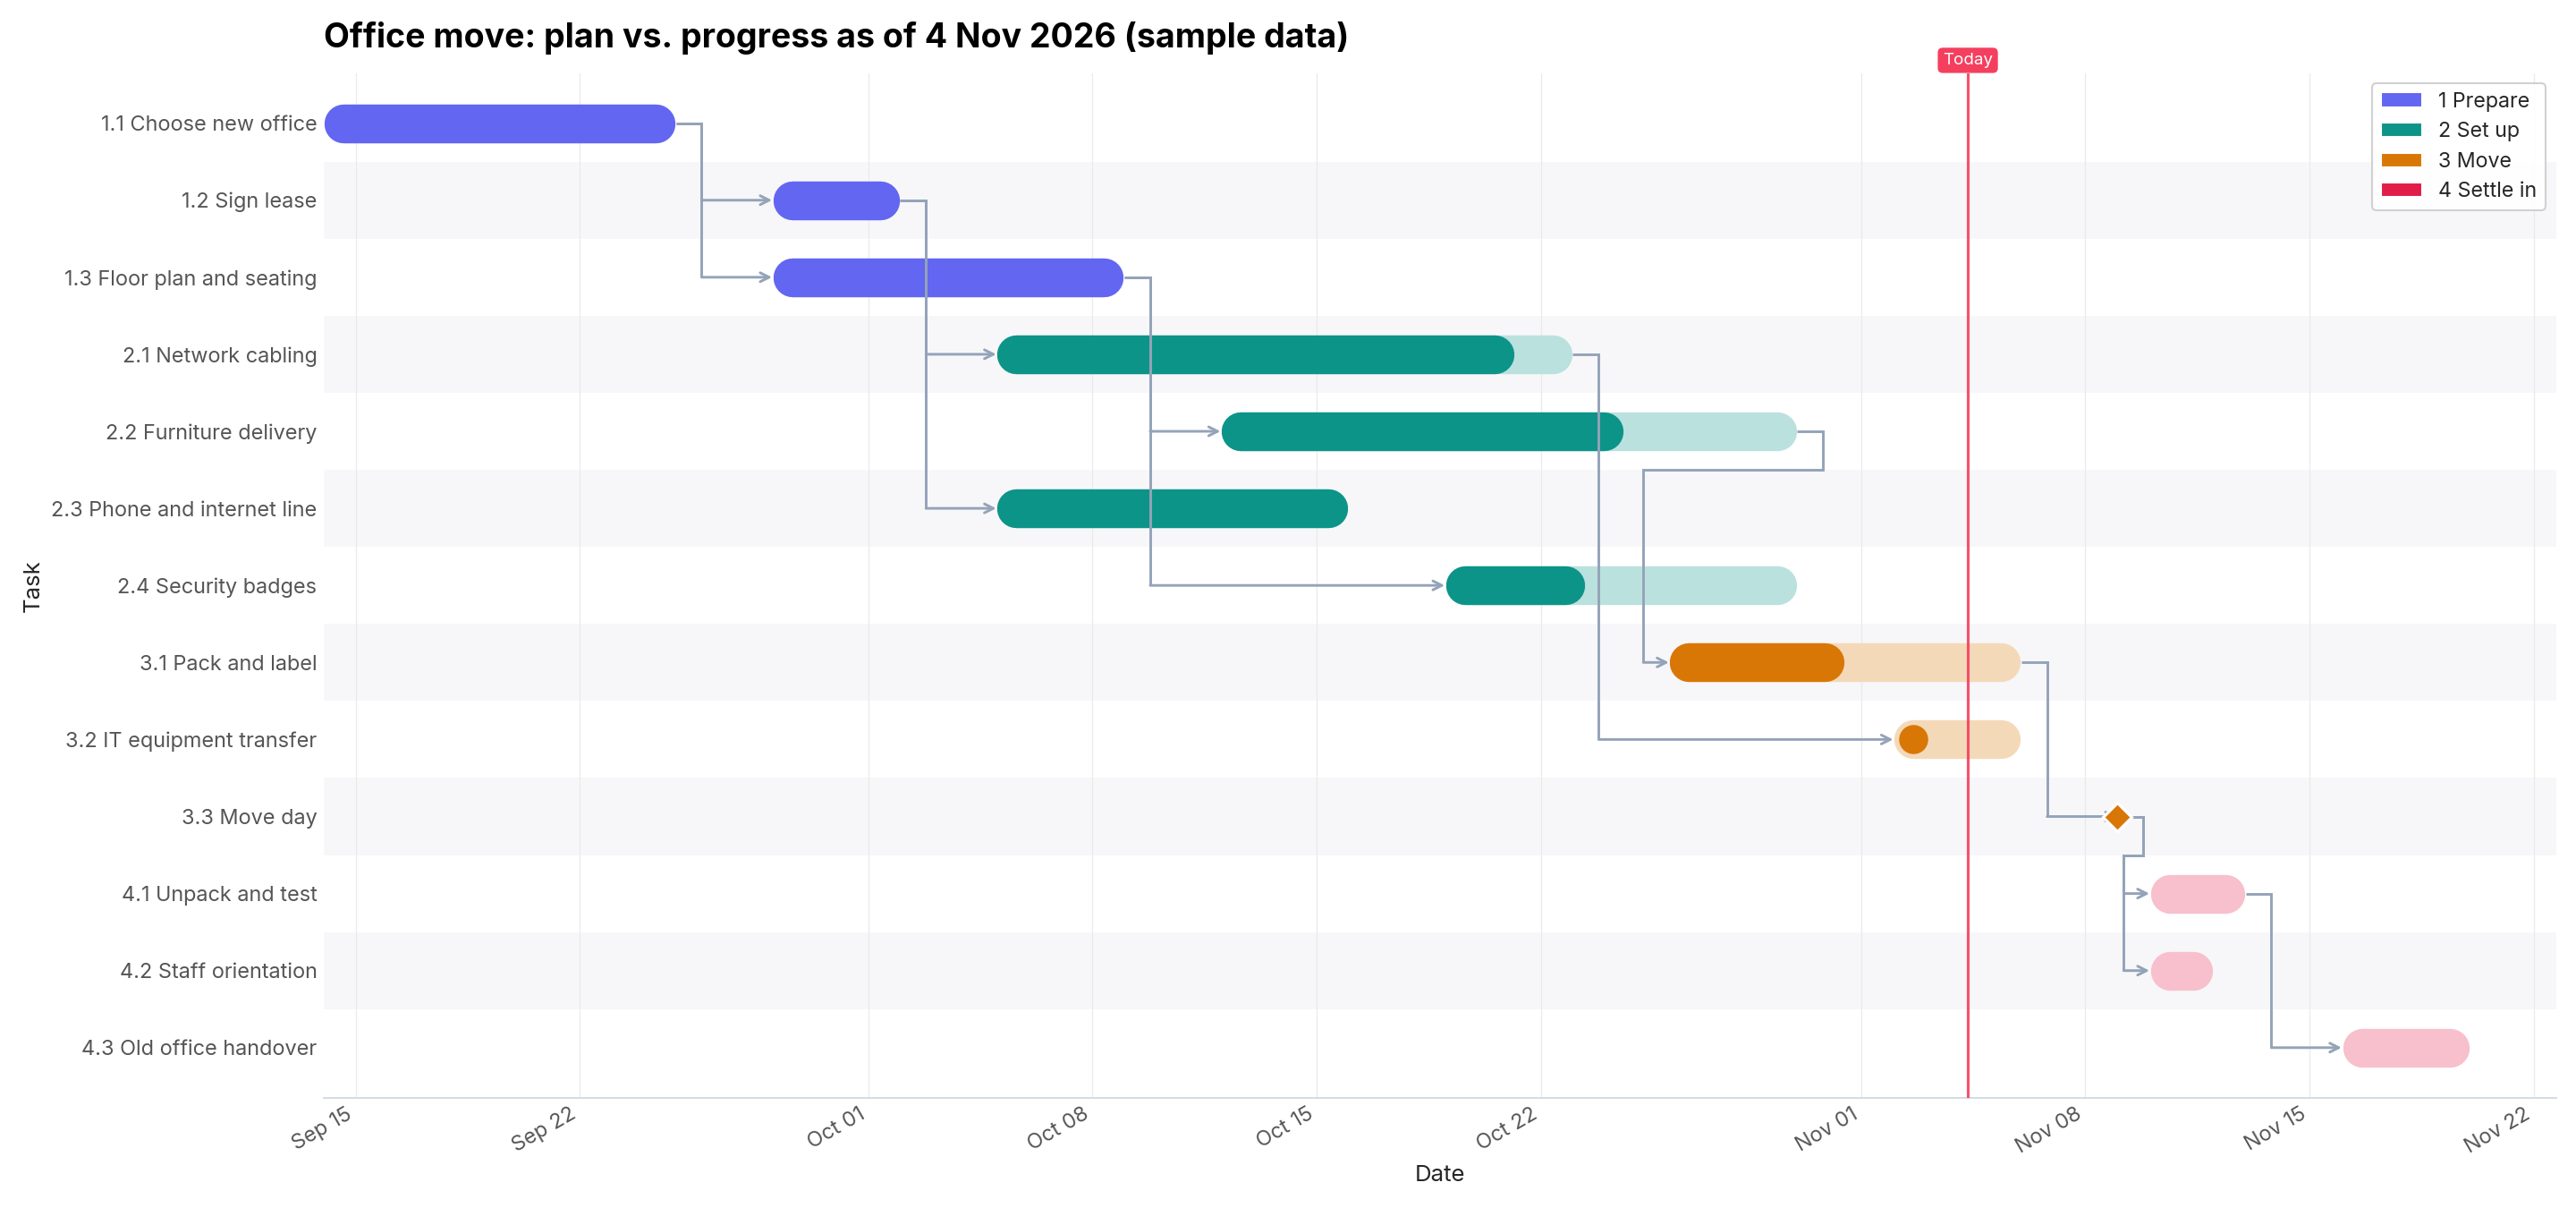
The sample below is invented for this article, not a client project. It has 13 tasks in four phases, with dependencies, progress and three owners. You can download the sample file (CSV). The chart was drawn with CleanChart's Gantt chart maker; the red line is 4 November 2026, the day the report was calculated.
The numbers at the top
We ran the sample file through CleanChart's project report engine with 4 November 2026 as the reporting date. It returned status Red with this reason: "17 points behind plan, 3 overdue tasks". The four headline figures:
- 67% complete, while the plan says 84% should be done by that date
- 17 points behind plan
- 3 tasks overdue: network cabling, furniture delivery and security badges
- 9 December 2026 forecast finish, against a planned 20 November 2026
What the report found, in the engine's own words
The engine ranks each finding as finding, impact, recommendation. These are the eight it returned for this file:
- High: At your current pace, the end date slips by about 13 working days. Work is progressing at 80% of the planned pace.
- High: 5 tasks decide your end date, none has a single day of slack: furniture delivery, pack and label, move day, unpack and test, old office handover.
- High: A critical task starts 5 working days before its predecessor is finished. Pack and label starts while furniture delivery is still running.
- High: 1 task on the critical path is behind plan by up to 30 points. Pack and label is 50% done.
- High: 3 tasks are overdue and not marked done.
- High: The project is 17 points behind plan.
- Medium: One person owns 50% of the tasks that decide your end date. Omar is responsible for 2 of 4 critical tasks.
- Low: 2 consecutive phases overlap by 5 working days.
Notice what a plain percent-complete column would not have told you. The strongest finding is not an overdue task: it is a dependency conflict. Packing is scheduled to begin before the furniture it depends on has arrived, so the plan contradicts itself. A status table lists tasks; a report compares them.
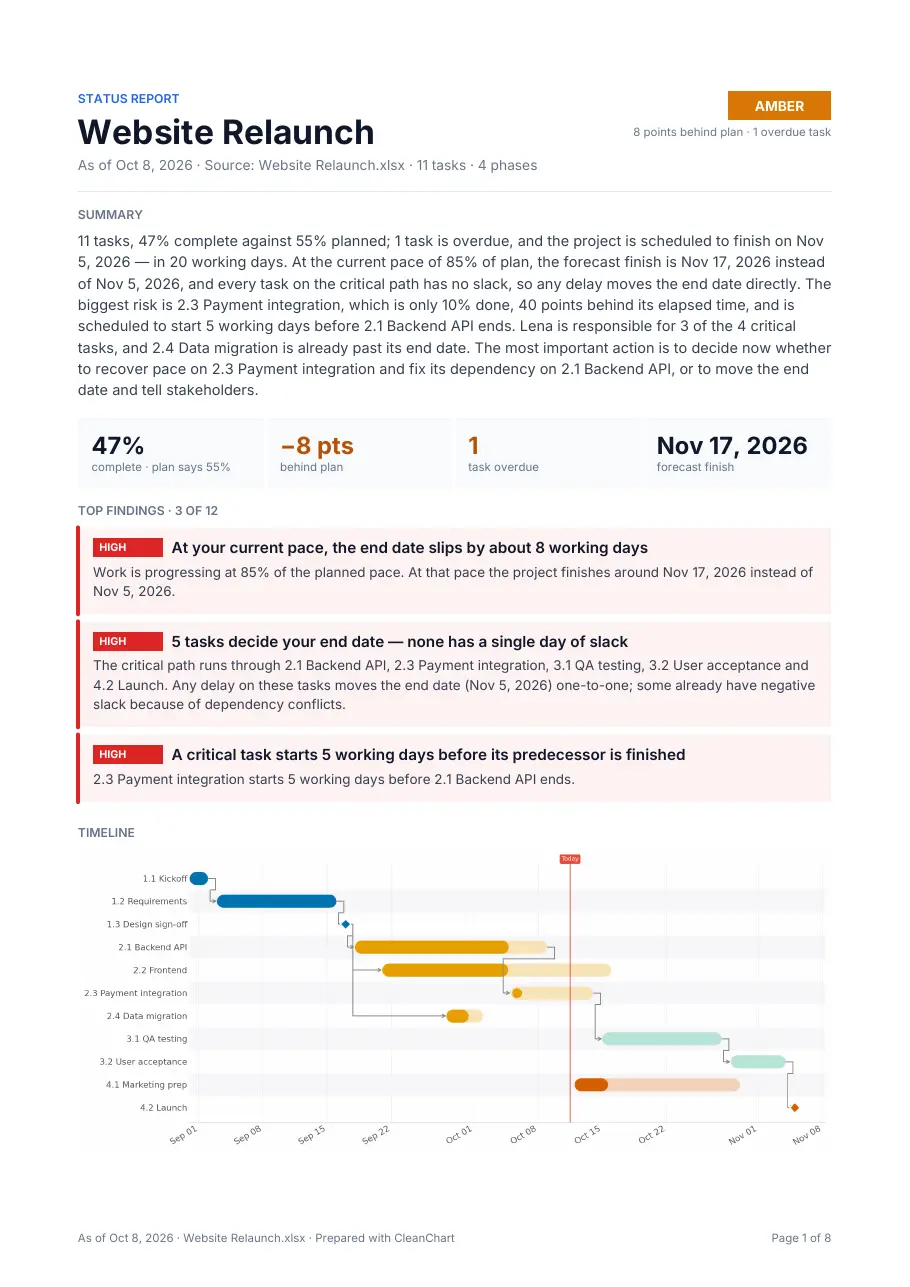
For the layout of a finished report, open the 8-page sample PDF. Its first page is a one-page brief with status, KPI tiles, the top three findings and a written summary:
How do you calculate status in Excel?
You can do the core arithmetic with formulas, and for a short list of tasks that is enough. The ideas are standard project-management practice, described in Wikipedia's article on earned value management.
- Planned percent per task. How much of the task's time has elapsed on the reporting date: (today minus start) divided by (end minus start), kept between 0 and 1.
- Variance. Actual percent complete minus planned percent, weighted by task length. Negative means behind.
- Overdue flag. End date before today and progress below 100.
- Status colour. Pick thresholds you can defend, for example green within 5 points of plan, amber within 15, red beyond. Thresholds are a judgement call; write them on the sheet.
- Forecast finish. Divide elapsed time by the share of planned work done to get the pace, then stretch the remaining time by that pace.
What Excel does not do by itself is the dependency analysis. Finding the critical path means walking every predecessor link forward and backward, which is the method behind the critical path method. It is possible with helper columns, but it is fragile once dependencies branch, and it is the part most hand-built status sheets skip.
How do you get the report without building it by hand?
- Fill in the template, or export your task list from Excel or another tool. Calendar dates are required.
- Upload the file to the Excel to Gantt chart converter or the CSV one and check the column mapping, including the dependency and progress columns.
- Once the Gantt chart renders, open the report offer. The teaser (number of findings and key figures) and a blurred preview of page 1 are free.
- To get the full PDF, a project report costs $2.99 for one dataset; it is also included in the 24h pass and the monthly plan.
A project file needs at least 5 tasks with calendar dates to be offered a report. Plans labelled "Week 1" or "Sprint 3" get no offer. The report is a multi-page English PDF for download; it is not saved to your dashboard, and the written summary is produced from the computed findings, not from your raw rows. More on what each report contains is at how CleanChart reports work.
Excel or CleanChart: which should you use?
| Option | Pros | Cons |
|---|---|---|
| Excel with formulas | No new tool; you control every threshold and layout; fine for a weekly update on a short task list | Dependency analysis and forecasts are manual and fragile; every formula is yours to maintain and check |
| CleanChart project report | Computes the critical path, dependency conflicts, forecast finish and owner load from the file; one-page brief with written summary | Paid ($2.99 per report); English PDF only, no editing inside the app; needs calendar dates and at least 5 tasks |
Use Excel alone when you have a handful of tasks and a fixed report format your stakeholders already know. Use a generated report when dependencies matter or when you want a second opinion on your own plan. Microsoft documents its own approach in Create a Project report.
Frequently Asked Questions
What should a project status report include?
Overall status, percent complete against plan, overdue tasks, a forecast finish date, the main risks and what you need from the reader. The office-move example above covers each of those in its first four figures and eight findings.
Is there a free project status report template for Excel?
Yes, the template file on this page is free; open it in Excel and save as .xlsx. The template is the input table. A generated PDF report is a paid feature, with a free teaser.
What columns does a project file need for a status report?
Task, start and end dates give you a plan review. Adding a progress or status column switches on the status report, a dependency column adds the critical path, and an owner column adds workload per person.
How do I choose the red, amber or green status?
Base it on how many points the project is behind plan. In the example, 17 points behind with 3 overdue tasks returned red. Whatever thresholds you pick, write them down so the colour means the same thing every week.
Can I use a Jira or Microsoft Project export?
Yes. CleanChart has converters for both, for example Microsoft Project to Gantt chart; the status and owner columns in those exports feed the report.
Related CleanChart Resources
Tools
- Excel to Gantt Chart Converter – Upload a task list and open the report preview
- CSV to Gantt Chart Converter – The same flow for CSV files
- Gantt Chart Maker – Build the chart from any task data
Related Blog Posts
- Gantt Chart Report: Example and How to Make One – A full 8-page sample report, page by page
- How to Create a Gantt Chart: Step-by-Step – The chart before the report
- How to Turn a CSV Into a Gantt Chart – Preparing the file
External Resources
- Wikipedia: Earned value management – The planned-versus-actual measures behind schedule variance
- Wikipedia: Critical path method – How slack is calculated