A CSV task list turns into a Gantt chart the moment it has three things: a task name, a start date, and an end date. Upload it to the CSV to Gantt chart converter, and CleanChart detects the date columns and draws the timeline automatically — no formulas, no separate Gantt add-on, and no spreadsheet template to fight with.
That's the short version. The rest of this guide covers the part that actually varies by CSV: which column names CleanChart recognizes automatically, what to do when your dates aren't in a clean format, a full walkthrough with screenshots from the real upload flow, and how long the whole thing takes based on CleanChart's own usage data.
What Columns Does a CSV Need for a Gantt Chart?
A Gantt chart needs one row per task with, at minimum, a task label and either two dates or a date plus a duration. A minimal CSV looks like this:
| Task | Start | End |
|---|---|---|
| Kickoff meeting | 2026-09-01 | 2026-09-02 |
| Design review | 2026-09-03 | 2026-09-09 |
| Build | 2026-09-10 | 2026-09-24 |
CleanChart doesn't require exact column names. It scans the header row and the data underneath for two things that parse as dates and a text column that doesn't, then offers that combination as the Gantt chart mapping. Useful optional columns:
- A duration column instead of an end date, if that's what your source system exports (CleanChart converts days, weeks or months into an end date).
- A group or category column (team, sprint, phase), so CleanChart colors bars by this column automatically once you map it.
- A percent-complete column to render progress bars inside each task.
None of these are required. A bare three-column CSV (task, start, end) is enough to get a working chart; everything else is refinement you can add afterward in the chart editor.
Step-by-Step: CSV to Gantt Chart
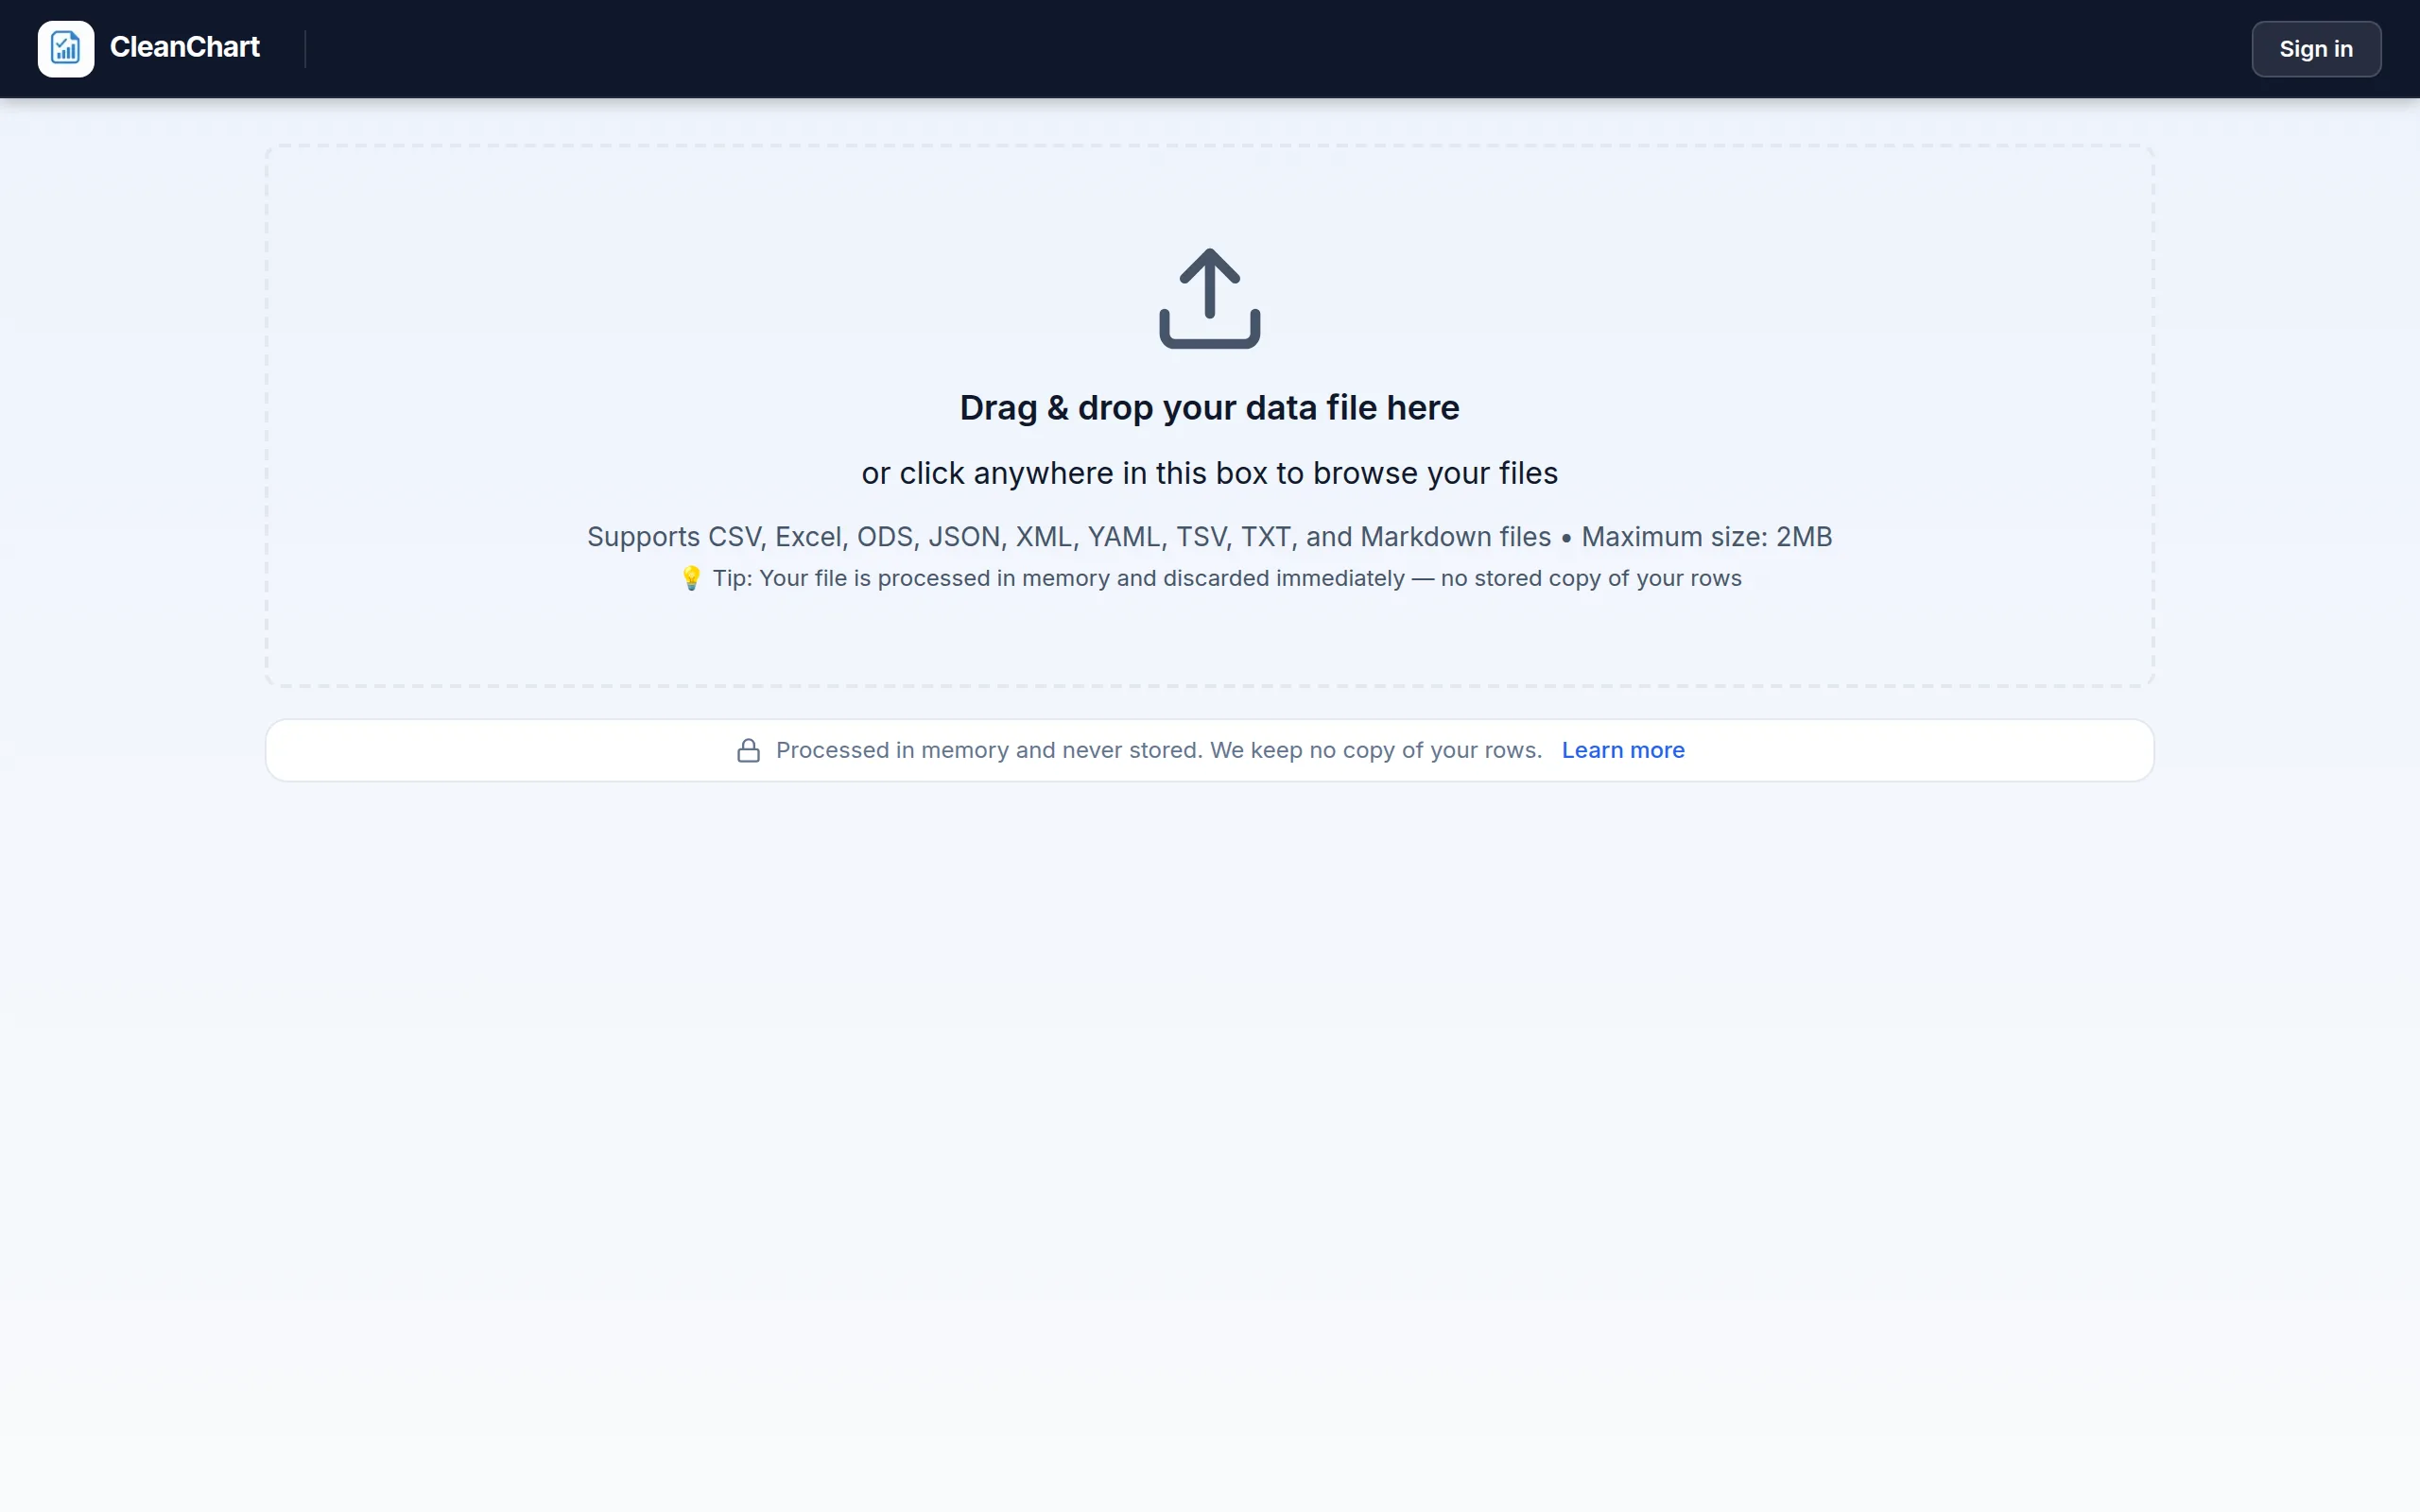
Here's a five-row task list, the same shape as the table above, uploaded to CleanChart's CSV to Gantt chart converter.
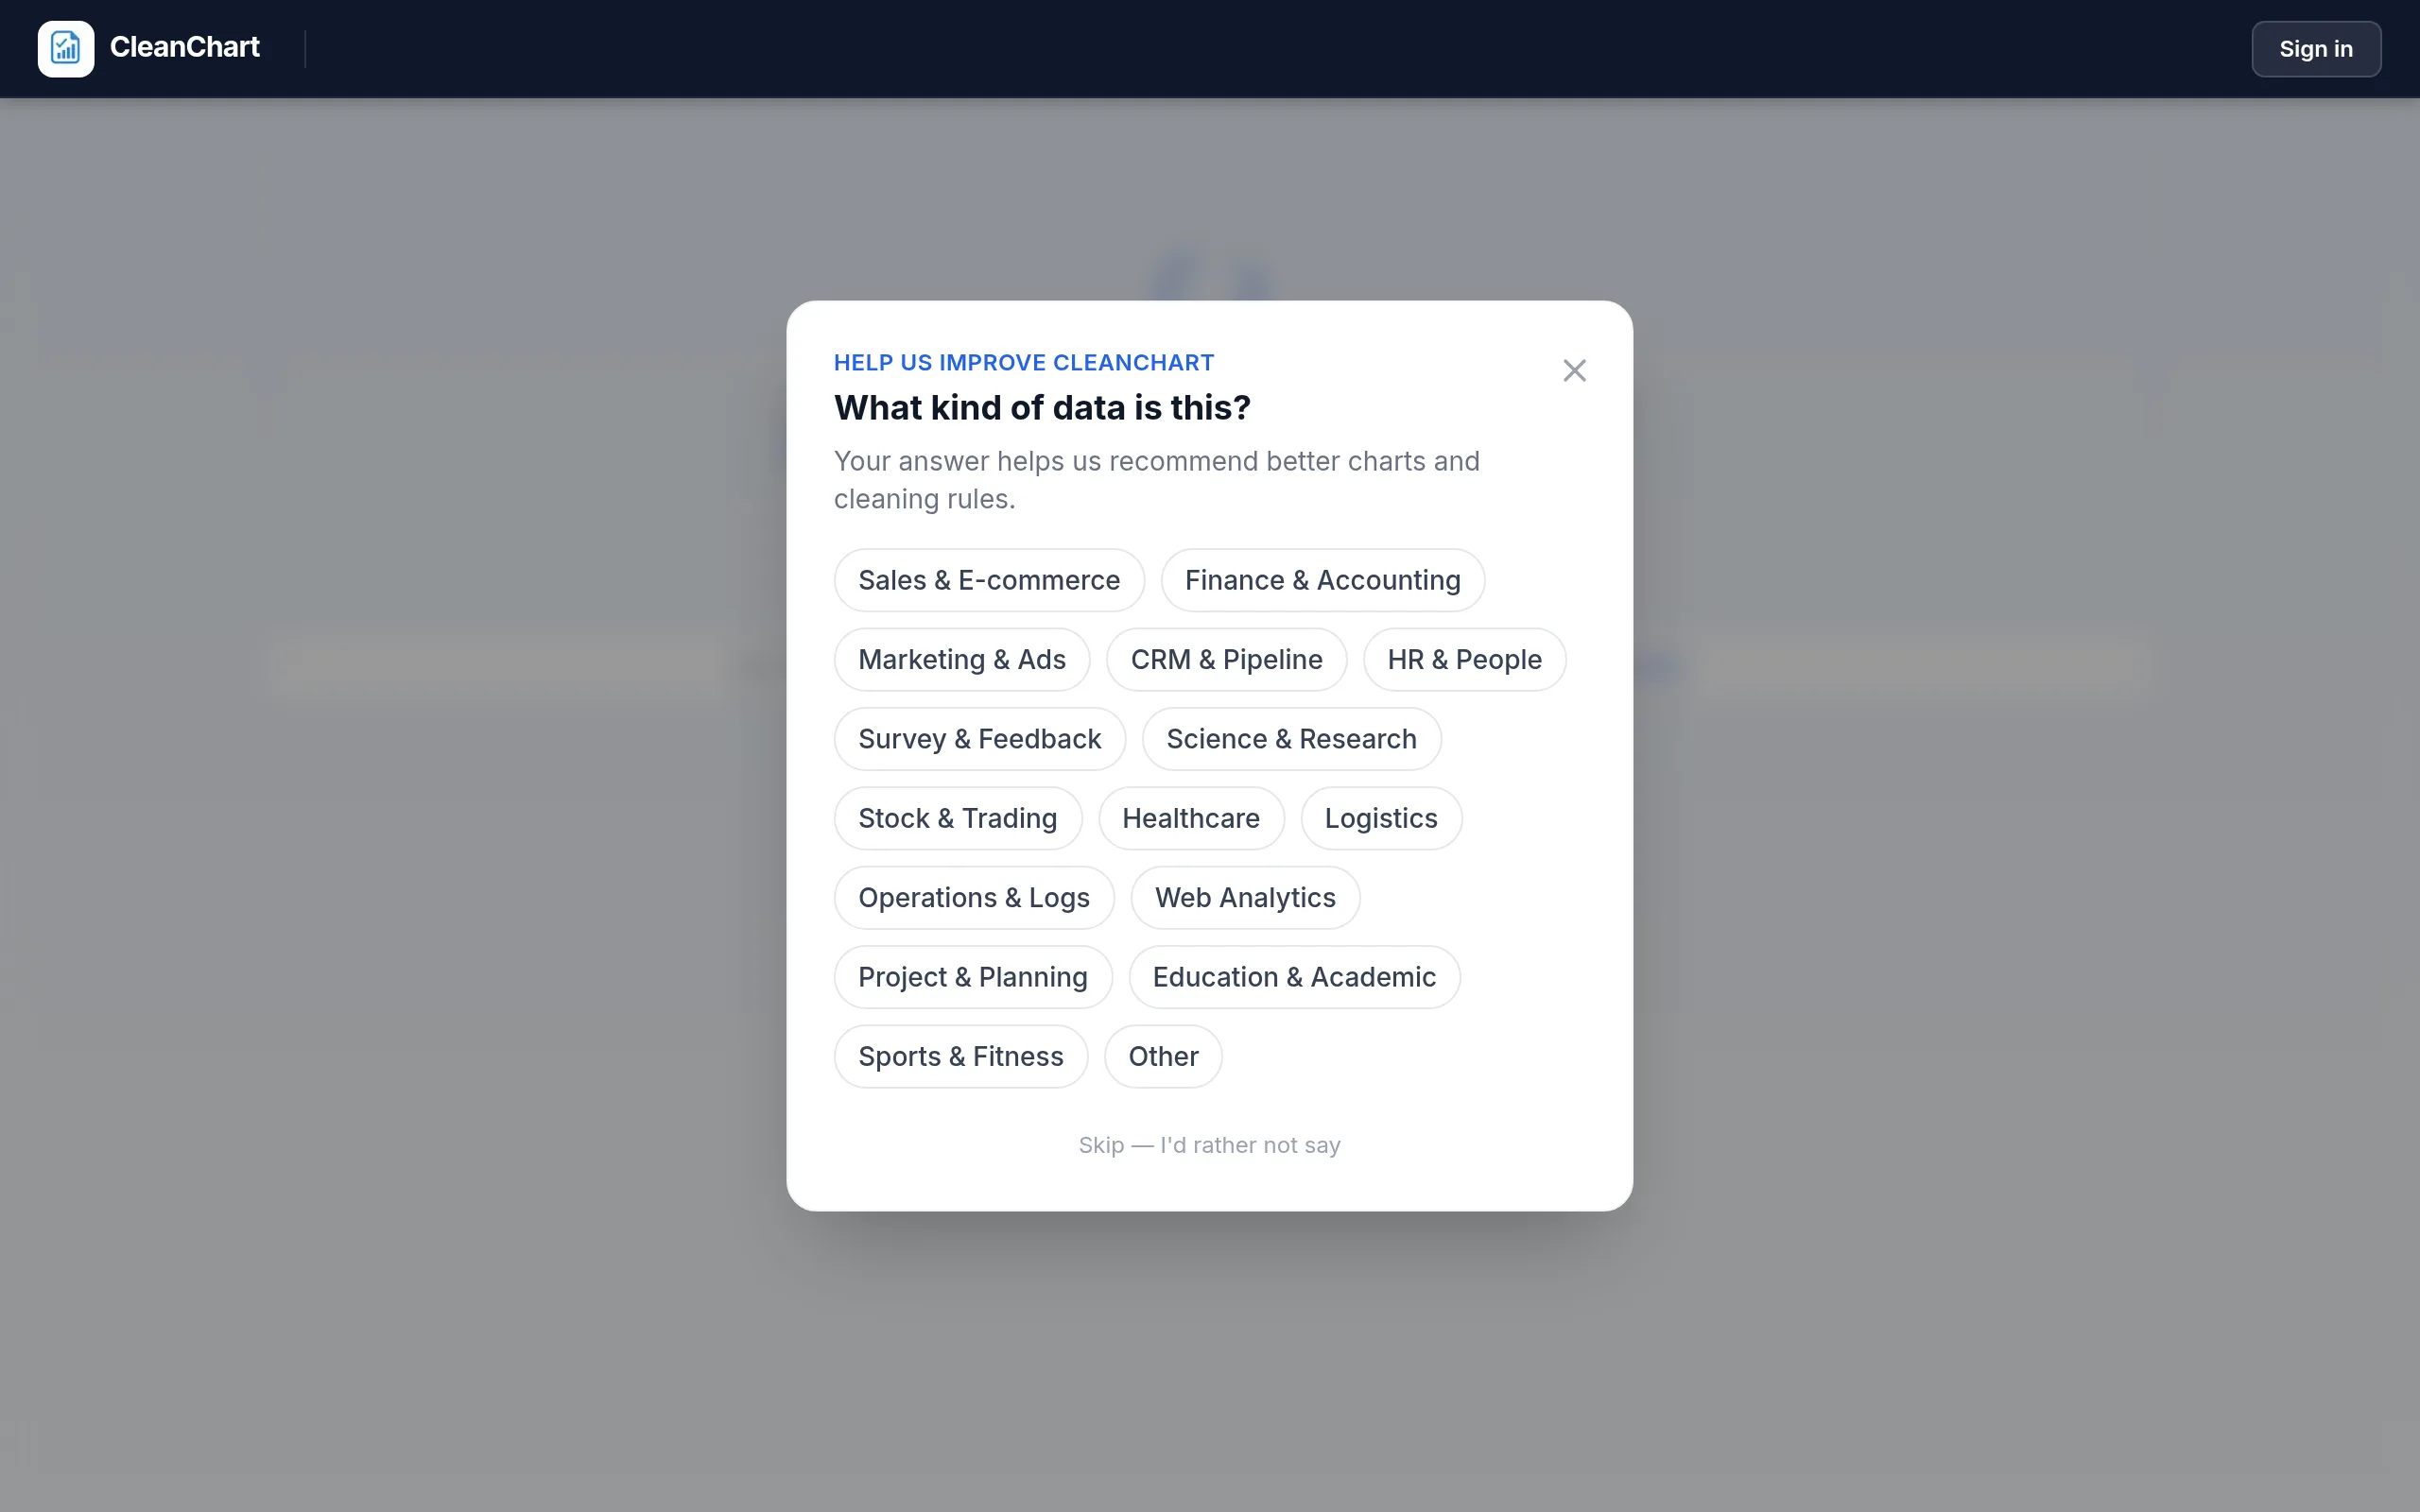
CleanChart asks what kind of data you uploaded so it can tune its chart recommendation. Picking Project & Planning is what points a task-plus-two-dates CSV at the Gantt chart type instead of, say, a line chart of the dates.
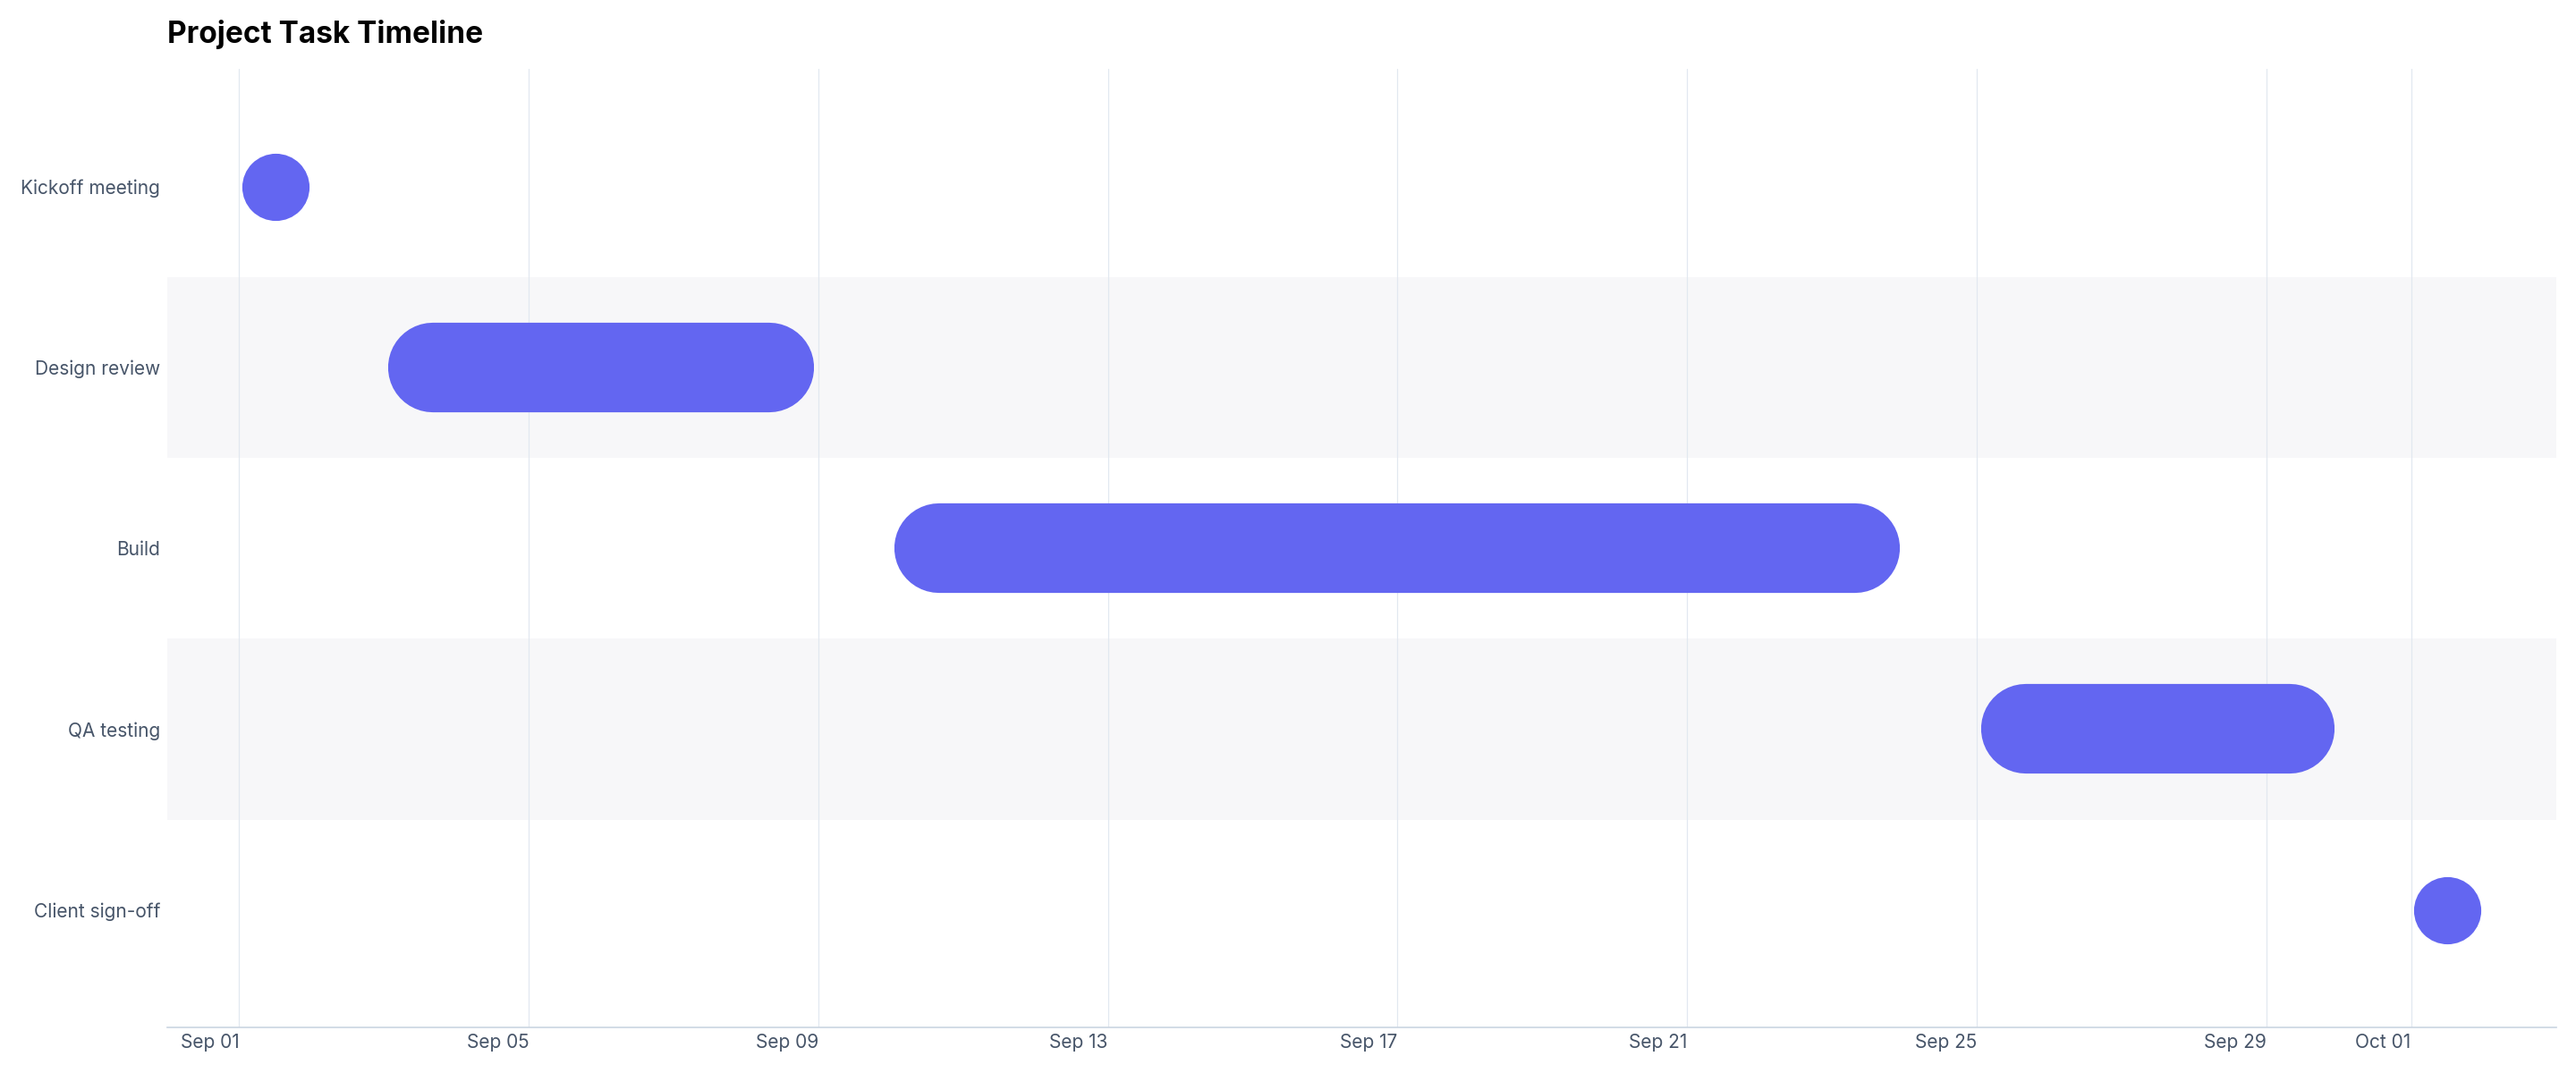
CleanChart maps Task to the row label and Start / End to the timeline, rendering each row as a rounded bar (or a dot, for a single-day task like the kickoff meeting) on a daily axis.
Export as PNG for a slide or status update, or SVG if you'll resize it in a document later. The free tier exports with a watermark at reduced resolution; a paid plan or a 24-hour pass removes the watermark and unlocks full-resolution PNG, SVG and PDF.
How Long Does It Take to Turn a CSV Into a Gantt Chart?
Fast enough that it's rarely worth timing, but CleanChart's own usage data puts a number on it. Across Gantt-chart sessions from May–September 2026, CSV uploads reached a rendered chart in a median of 14 seconds, versus 22 seconds for Excel workbooks.
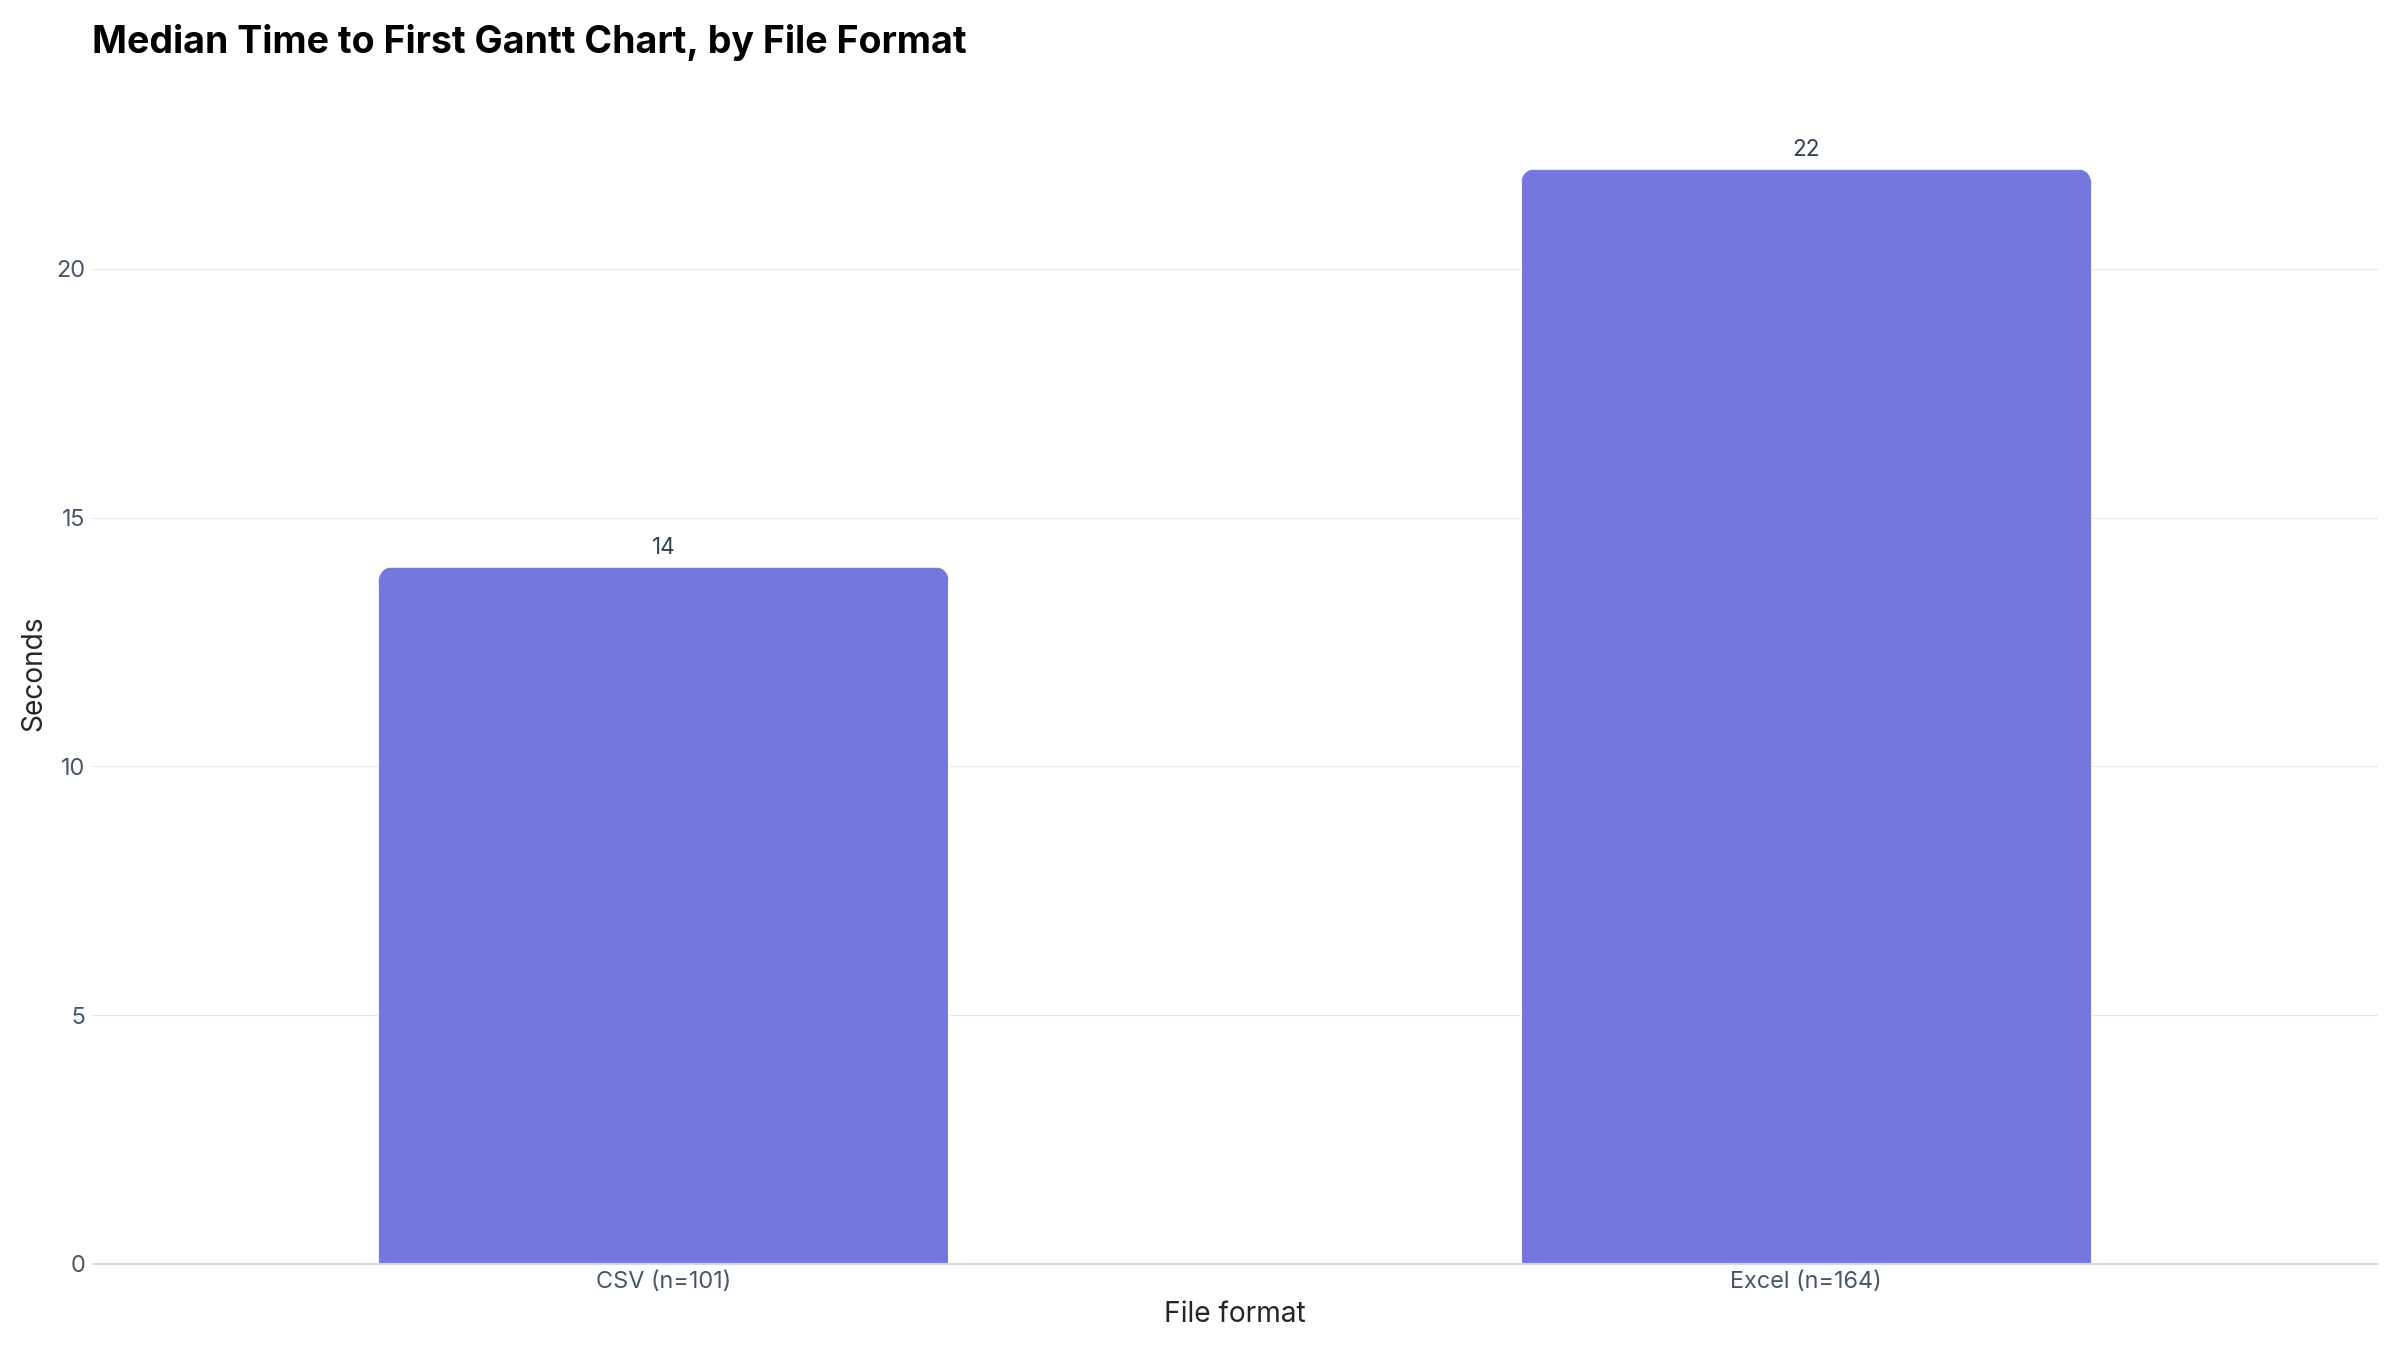
Practically, this means a CSV task list is the fastest path to a Gantt chart if you're choosing between exporting to CSV or Excel from whatever tool holds your project data today. Want to try it on your own list first? download the same five-row sample CSV used in the walkthrough above.
Common Problems When Charting a CSV Task List
Dates in an inconsistent or ambiguous format
A CSV exported from a spreadsheet or a project tool can carry dates as 09/01/2026, 1-Sep-26, or a dozen other shapes, and it's plain text, so there's no underlying date type to fall back on, unlike an Excel file. CleanChart's automatic cleaning parses common date formats and standardizes them before mapping the start and end columns; if a column still won't parse, it's flagged rather than silently misread.
Missing end dates or durations
A row with a start date and nothing else has no end point to plot. Either fill in an end date (or a duration) for every task before exporting, or expect that row to be dropped from the chart.
Too many rows for a readable chart
A Gantt chart reads best with roughly 8–20 tasks. A CSV with hundreds of rows, a full project backlog, say, produces a chart with more bars than anyone can read at a glance. Filter to one phase, sprint or milestone group before charting the whole thing.
A header row that doesn't look like a header
If your CSV's first row is a title or a blank line rather than column names, CleanChart may try to chart it as data. Strip anything above the actual column headers before uploading.
What About Excel, Jira, or Microsoft Project?
Everything above applies to a CSV specifically, but the underlying process (task label, start, end, optional group and progress columns) is the same whatever the source. For a workbook instead of a CSV, use the Excel to Gantt chart converter directly, or see the timing comparison above if you're deciding between exporting to CSV or keeping the native Excel file.
Two other common sources: teams exporting sprint or backlog data get a full walkthrough in the Jira export guide. Microsoft Project users can export to CSV and use this same flow, or go straight to the Microsoft Project to Gantt chart converter.
Frequently Asked Questions
Can I make a Gantt chart from a CSV file without Excel?
Yes. A CSV needs no spreadsheet program to become a Gantt chart — upload it directly to CleanChart's CSV to Gantt chart converter and it renders in the browser tab, no Excel, no formulas, no separate Gantt add-on.
What columns does my CSV need for a Gantt chart?
At minimum: a task name column and either a start-and-end date pair or a start date plus a duration. A group column for color-coding and a percent-complete column for progress bars are optional additions.
Why is my CSV Gantt chart showing tasks in the wrong order?
CleanChart plots tasks in the order they appear in the CSV, not sorted by date. Sort the rows by start date in your spreadsheet or source export before uploading if you want the chart to read top-to-bottom chronologically.
Can I use a duration instead of start and end dates?
Yes — map a duration column (in days, weeks or months) instead of an end date, and CleanChart calculates the end point from the start date and duration.
Why do my CSV dates look wrong after uploading?
A CSV stores dates as plain text, so a date can arrive in almost any format depending on what exported it. CleanChart's automatic cleaning standardizes common formats before charting; if a date still looks off, check that the source column wasn't reformatted by a spreadsheet program in between export and upload.
Does the free plan work for a CSV Gantt chart?
Yes — uploading, chart generation and PNG export are free, with a "Made with CleanChart.app" watermark and reduced resolution. A subscription or a 24-hour pass removes the watermark and unlocks full-resolution PNG, SVG and PDF export.
Related CleanChart Resources
Gantt Chart Tools
- CSV to Gantt Chart Converter – Upload any CSV task list directly
- Excel to Gantt Chart Converter – Same flow for .xls/.xlsx workbooks
- Microsoft Project to Gantt Chart – For MS Project exports
- Gantt Chart Maker – Build a Gantt chart from any data
Related Blog Posts
- How to Create a Gantt Chart: Step-by-Step – The general-purpose guide
- How to Turn a Jira Export Into a Gantt Chart – The same flow starting from Jira
- Project Management Pie Chart & Gantt Guide – Gantt charts alongside other project visuals
- The Complete Guide to Cleaning CSV Data in 2026 – What to fix in a CSV before charting it
External Resources
- Wikipedia: Gantt Chart – History and detailed explanation of Gantt charts
- RFC 4180: Common Format for CSV Files – The closest thing to an official CSV specification, useful for understanding why exports vary
Last updated: September 24, 2026