Jira doesn't have a built-in Gantt view outside its paid Advanced Roadmaps add-on — but you don't need one to turn a sprint or backlog into a timeline. Export your issues as a CSV, map the date columns, and CleanChart renders the Gantt chart directly, no plugin required.
The short version: from your Jira board or backlog, run Export > Export CSV (all fields or current fields), make sure the export includes a start date (or add one — more on that below) and a due date, then upload the file to the Jira to Gantt chart converter. CleanChart detects the two date columns automatically and draws the timeline in seconds.
The rest of this guide covers the part that trips people up: which Jira fields actually map to a Gantt chart, why Jira's default CSV date format confuses some tools, and a full walkthrough with screenshots from the real upload flow — plus what CleanChart's own usage data shows about Gantt charts built this way.
Why Export Jira to CSV Instead of Using Advanced Roadmaps?
Jira Software's native Gantt-style timeline lives behind Advanced Roadmaps, a premium add-on billed per seat. If you just need one timeline — for a status update, a client deck, or a sprint retro — exporting the issue list and rendering it elsewhere is faster and free.
A CSV export is also the right call when:
- You need the chart outside Jira — a slide, a PDF report, or an email update where a live Jira link isn't useful.
- Stakeholders don't have Jira accounts — a rendered image needs no login.
- You only need a one-off view — a snapshot of the current sprint or a project's remaining scope, not a maintained roadmap.
- Your team doesn't have Advanced Roadmaps enabled — common on Jira Software's standard and premium plans without the add-on.
If your team already maintains a live roadmap inside Jira and everyone who needs to see it has an account, keep using that — a static export is a snapshot, not a substitute for a shared workspace. For everything else, see our broader guide to creating a Gantt chart for the general case.
Which Jira Fields Do You Need for a Gantt Chart?
A Gantt chart needs three things per row: a task label, a start date, and an end date (or a duration). Here's how those map onto Jira's default fields:
| Gantt chart needs | Jira field | Notes |
|---|---|---|
| Task label | Summary (with Key as a fallback) | Summary alone is usually more readable than the issue key on a chart axis. |
| Start date | Start date custom field, or Created | Jira Software doesn't ship a standard "Start date" field on every plan. If your project doesn't have one, add a custom date field or use Created as a stand-in for when work began. |
| End date | Due date | Jira's built-in due date field. Issues without one won't get a usable end date — set due dates before exporting, or exclude them. |
| Color grouping (optional) | Sprint, Issue Type, or Epic | Any of these works as a category column so tasks are color-coded by sprint or type in the chart. |
None of this needs a plugin. It's the same issue data already in Jira — the export just needs to include the right columns.
How to Export Issues From Jira as CSV
Step 1: Filter to the issues you want on the chart
From your board, backlog, or a saved JQL search, narrow the list to the sprint, epic, or project slice you want charted. A Gantt chart reads best with roughly 8–20 tasks; export a filtered view rather than an entire project's backlog.
Step 2: Export as CSV
From the issue search results, use Export > Export CSV (current fields) to control exactly which columns come out, or Export CSV (all fields) if you're not sure which field holds your start date yet. "Current fields" is the faster path once you know your columns work.
Step 3: Confirm the date columns are populated
Open the CSV and check that Due date and your start-date field aren't blank for the issues you care about. A Gantt chart can't place a task it has no dates for — back-fill missing due dates in Jira and re-export rather than guessing dates after the fact.
Step-by-Step: Jira CSV to Gantt Chart
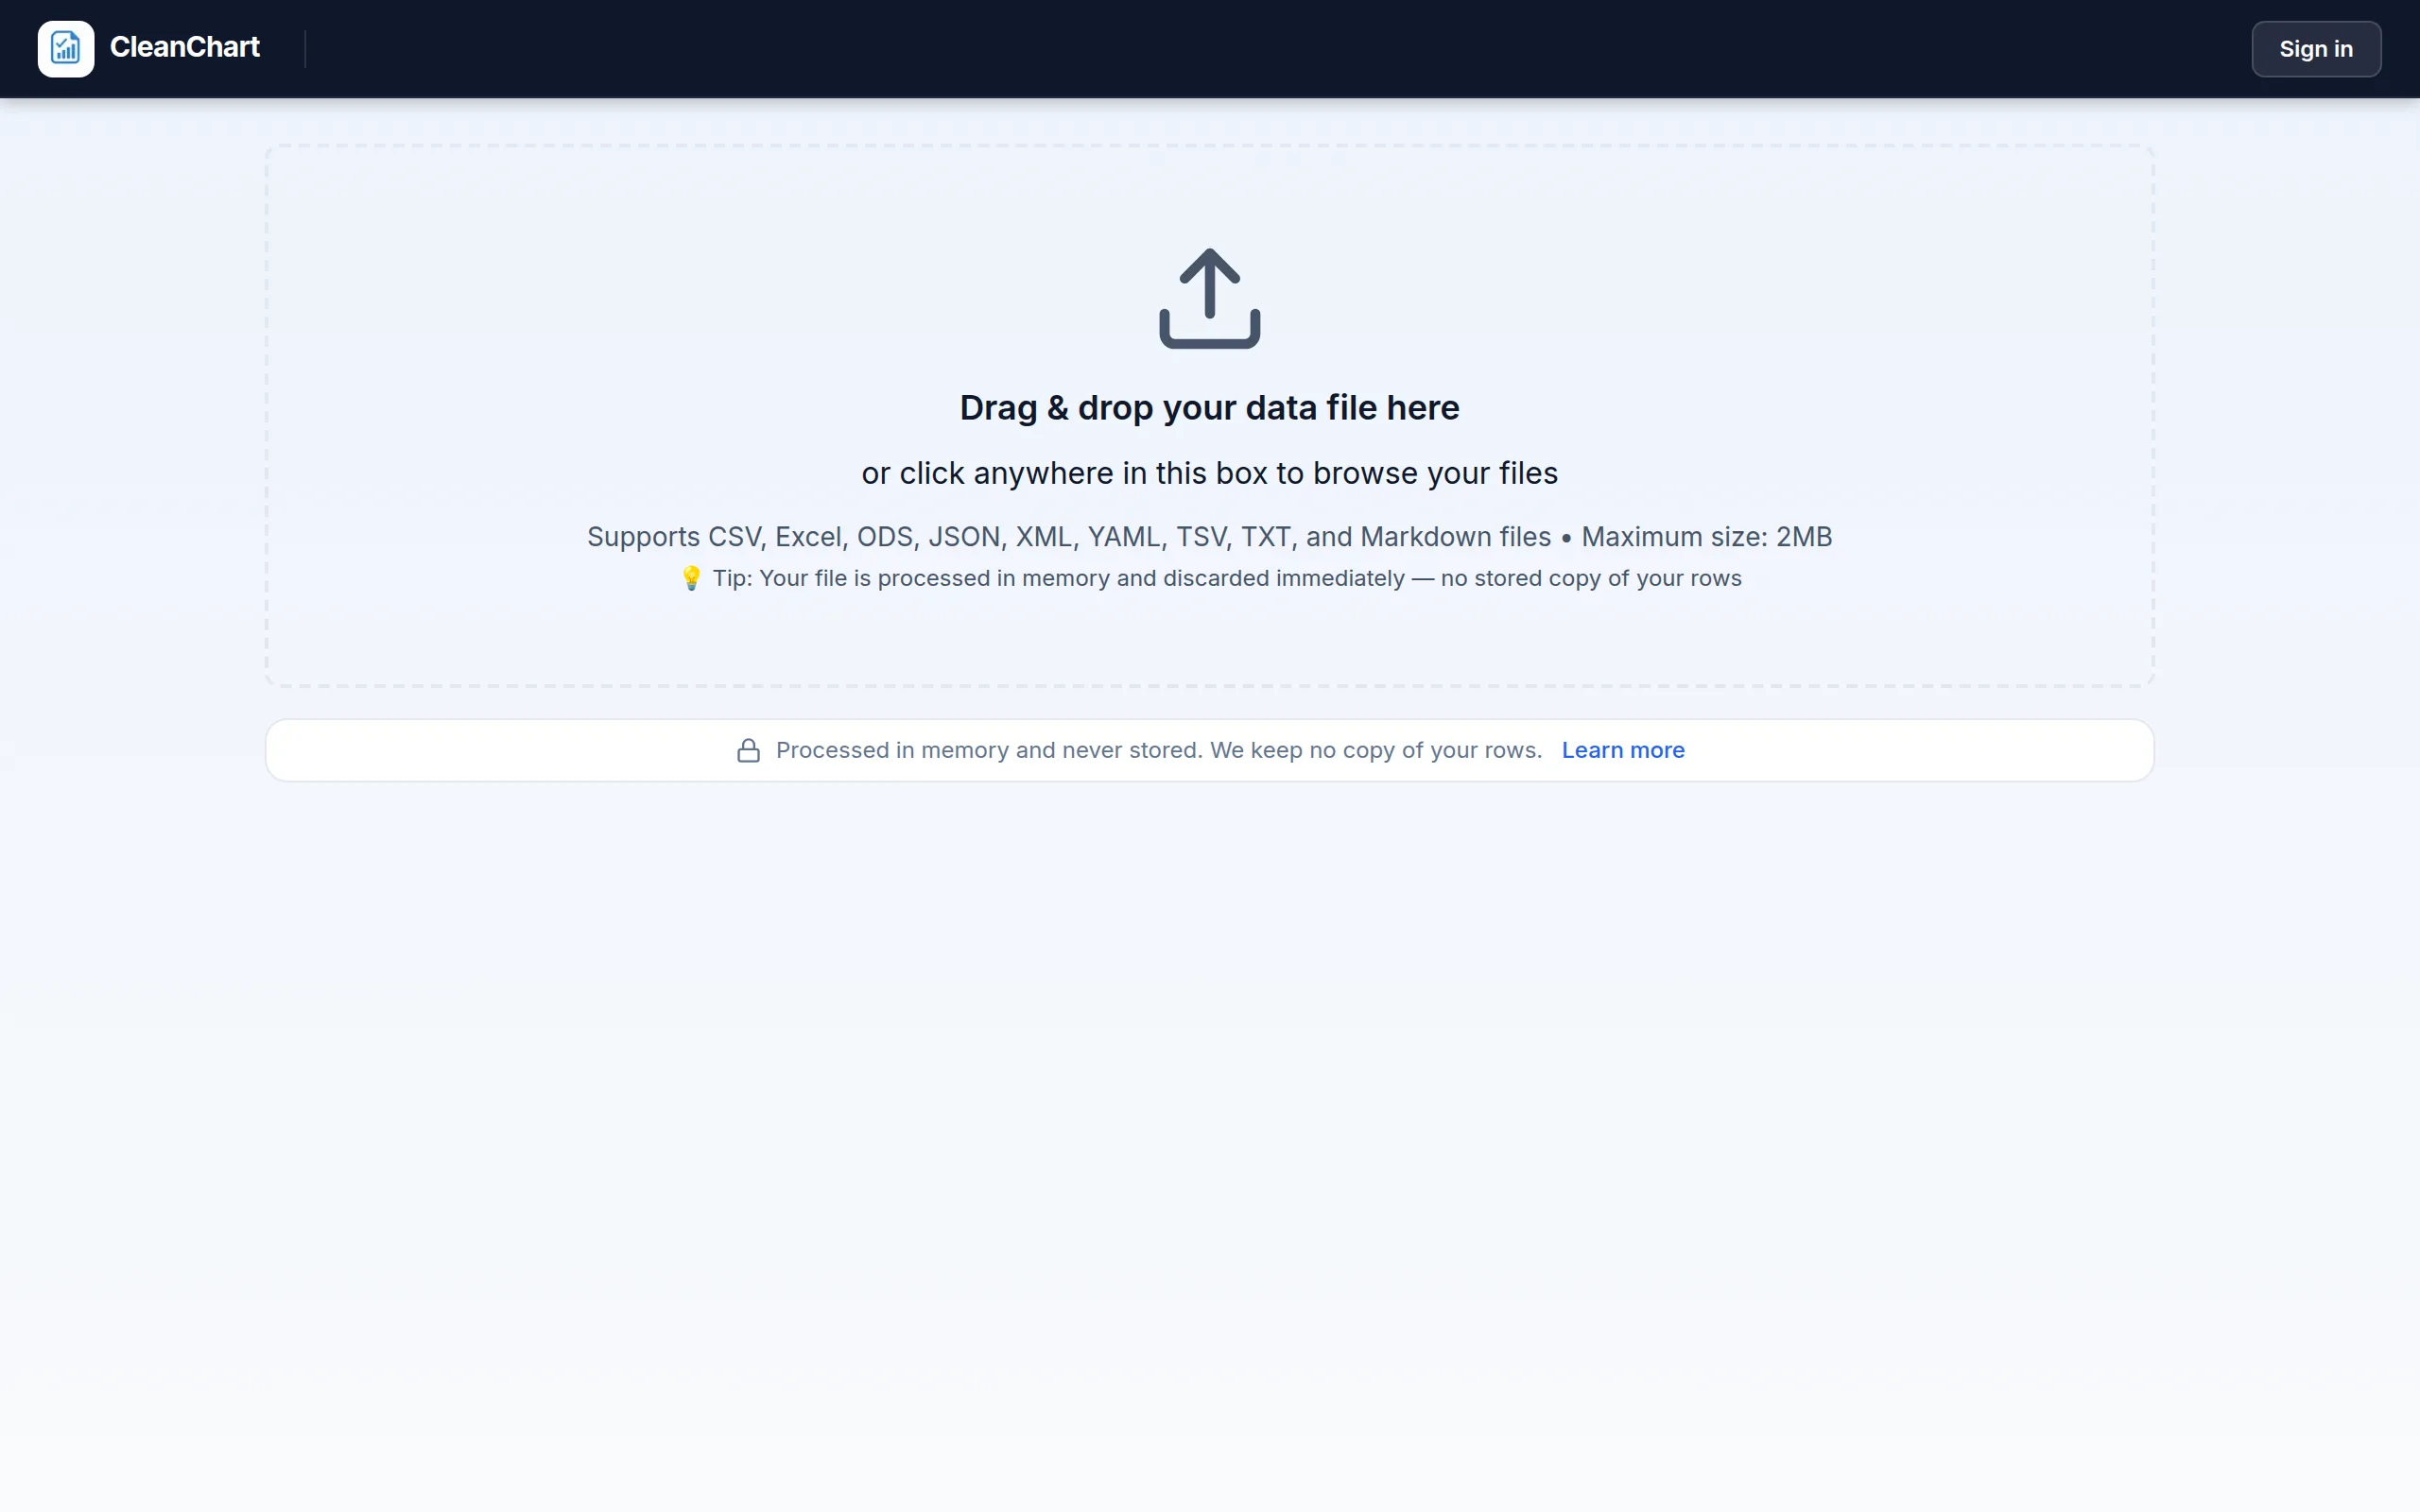
Here's the same export uploaded to CleanChart's Jira to Gantt chart converter, using a five-issue sample with Key, Summary, Start date, Due date, Sprint and Issue Type columns — the same shape as a real sprint export.
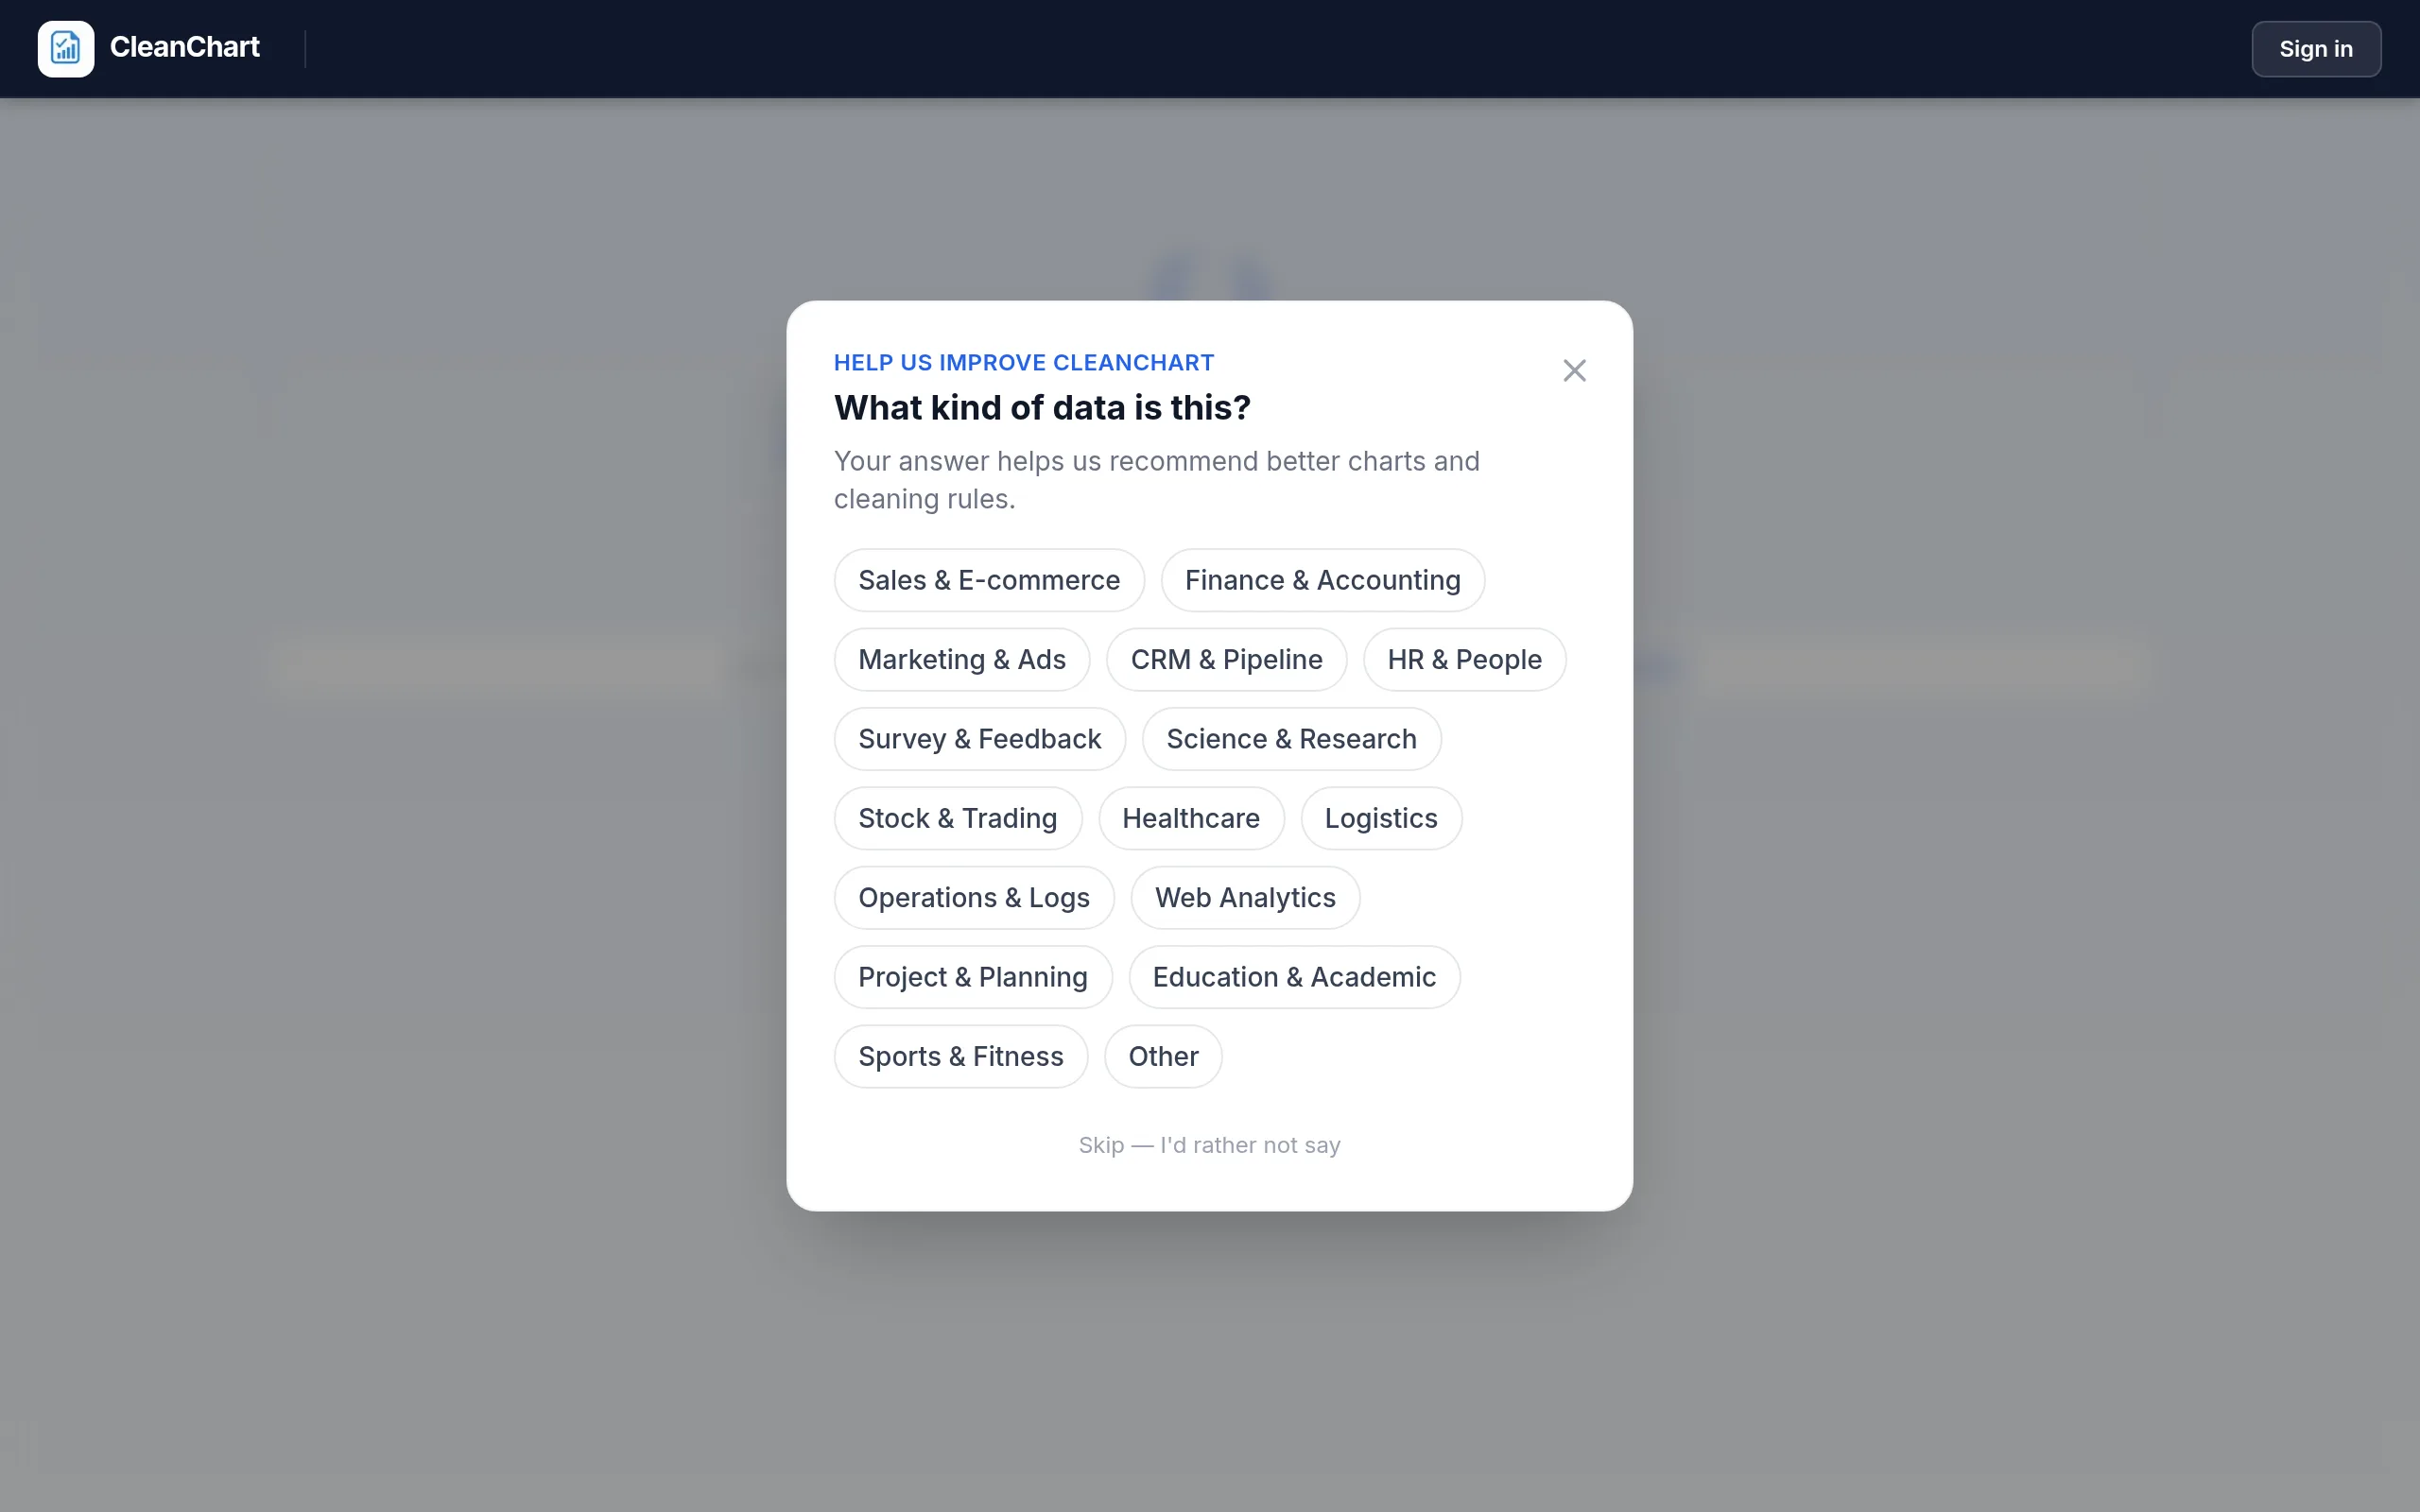
CleanChart asks what kind of data you uploaded so it can tune its chart recommendation. Picking Project & Planning is what points a two-date-column export like this one at the Gantt chart type instead of, say, a bar chart.
CleanChart maps Summary to the task label and Start date / Due date to the timeline, and colors each bar by Sprint automatically.
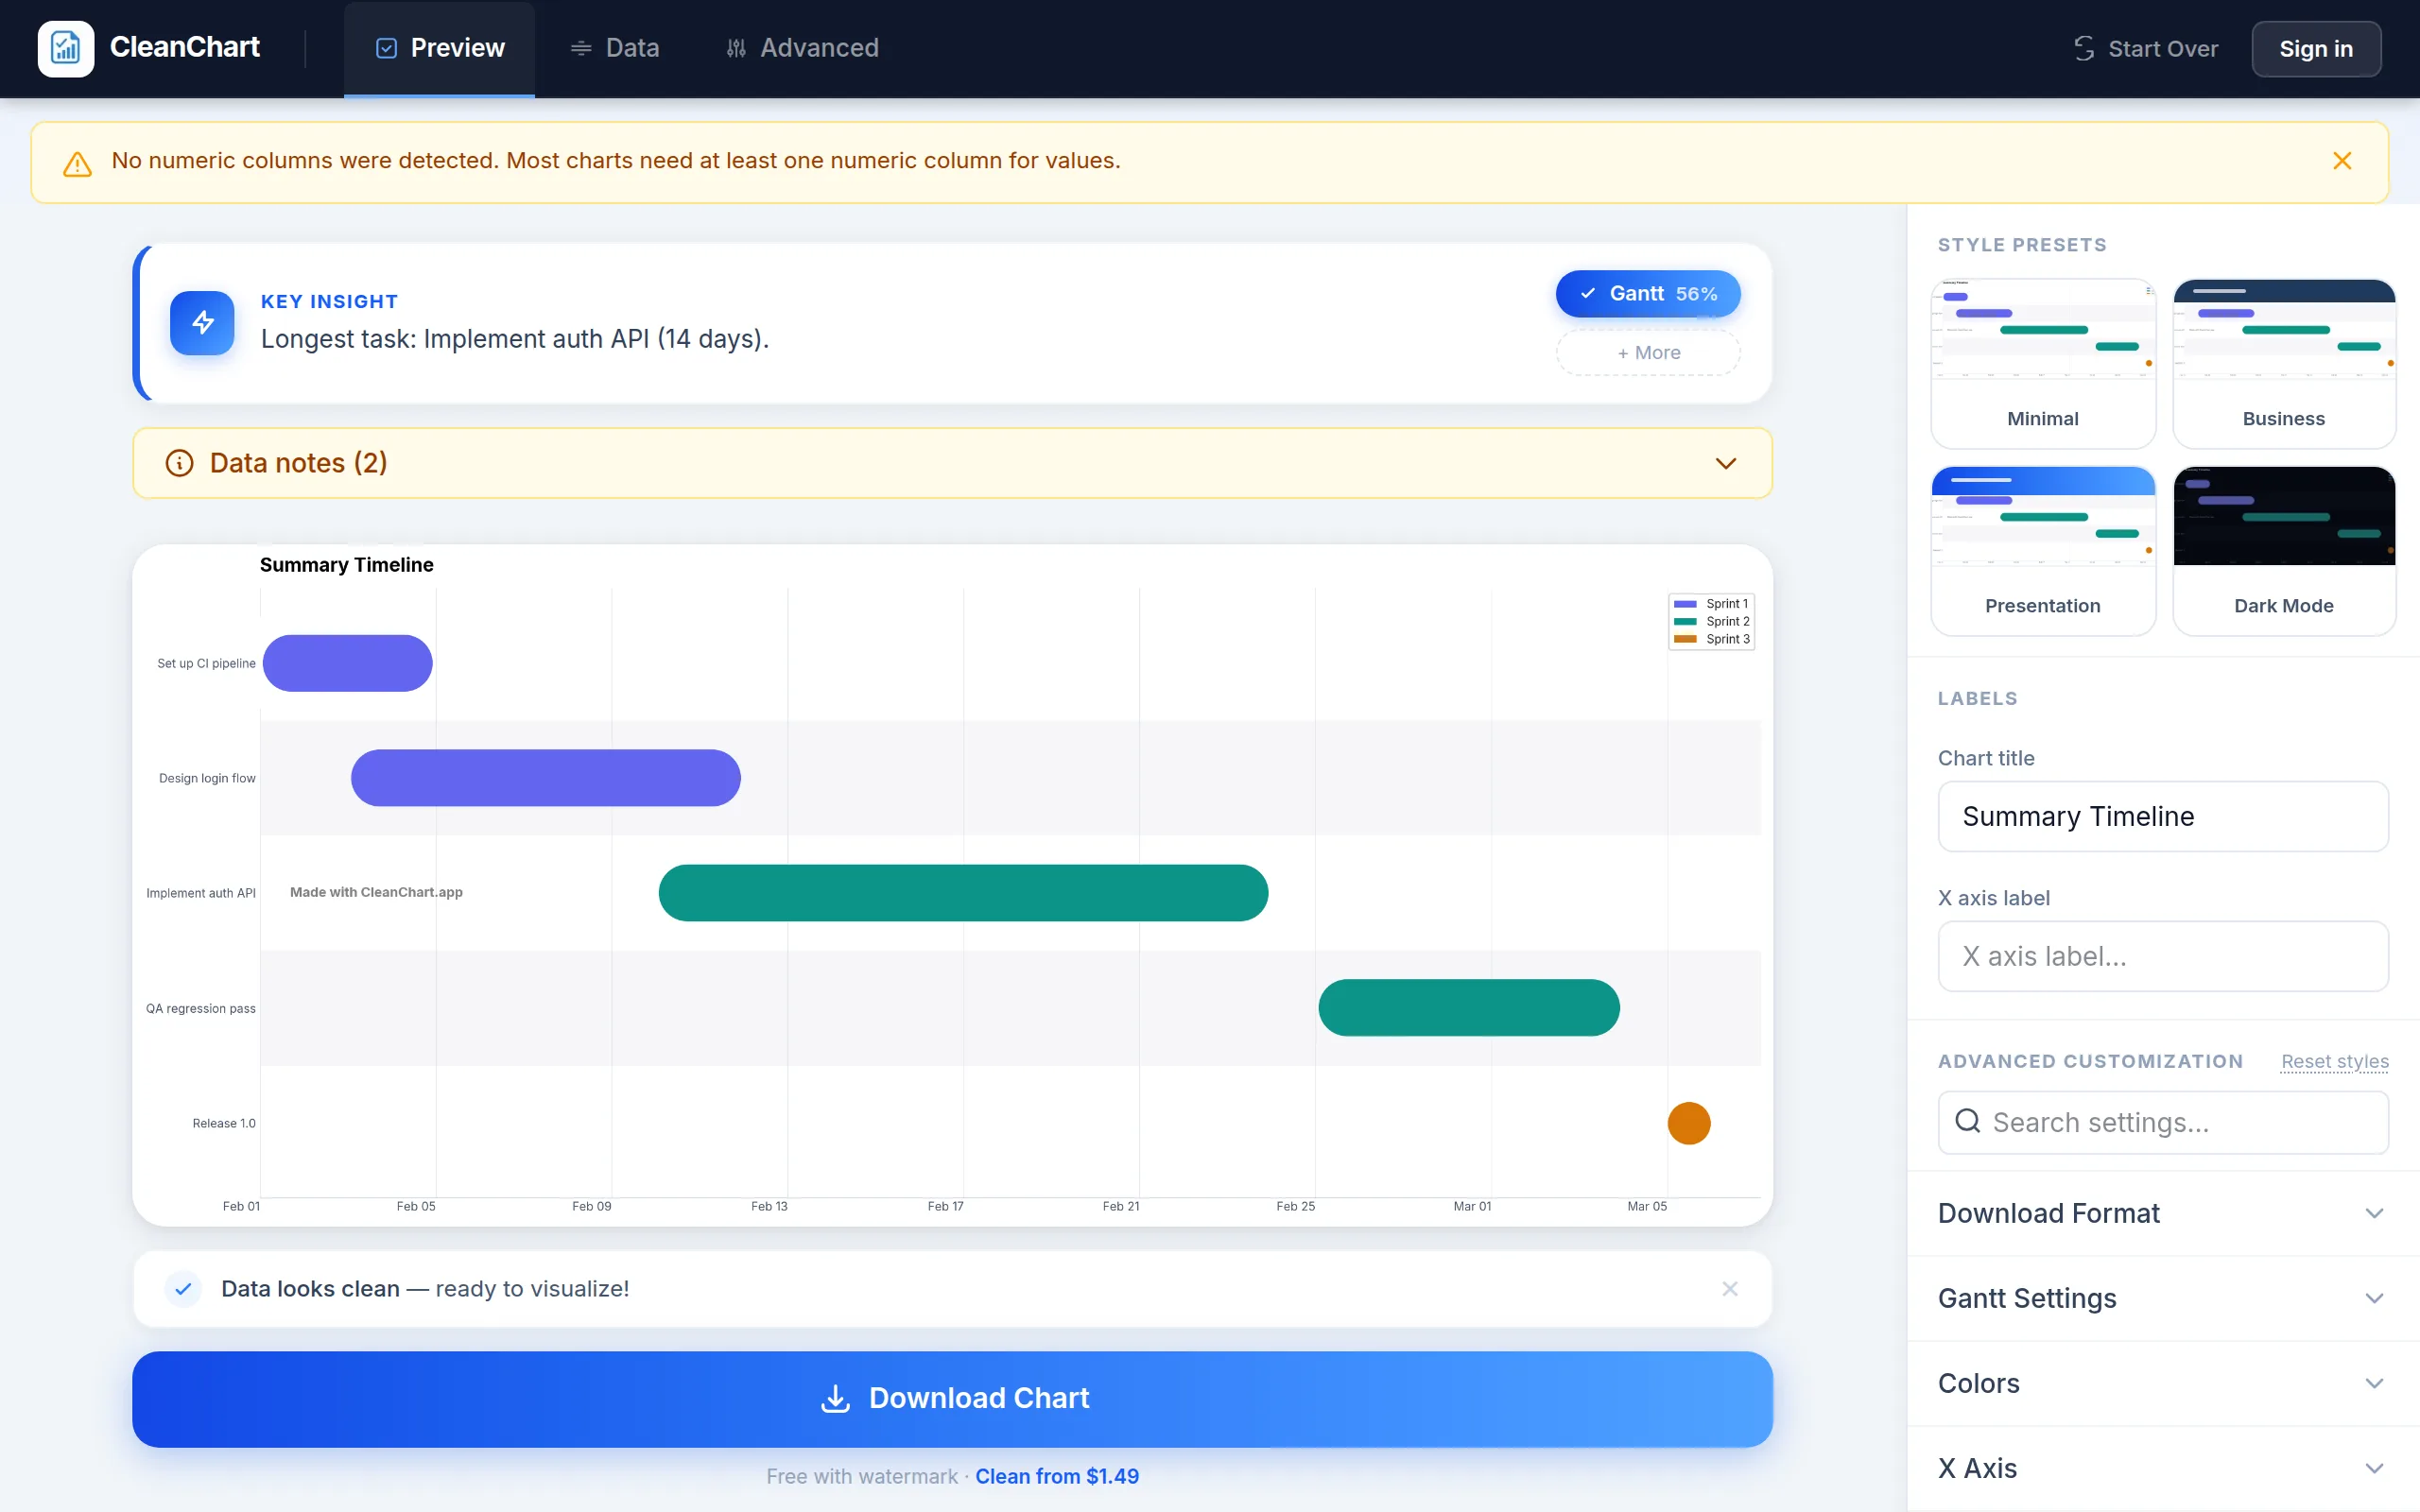
From here you can rename the chart title, switch to a dark or presentation color preset, adjust bar height, or turn on progress bars if your export included a percent-complete field. Export as PNG for a slide, or SVG if you'll resize it in a document later.
What CleanChart's Usage Data Shows About Gantt Charts
Jira issues aren't tagged as their own file format once they leave Jira — a Jira export is just a CSV (or occasionally an Excel file) by the time it reaches CleanChart. So rather than fabricate Jira-only numbers we don't have, here's what the underlying Gantt-chart usage looks like across all sources, which is exactly the population a Jira export falls into.
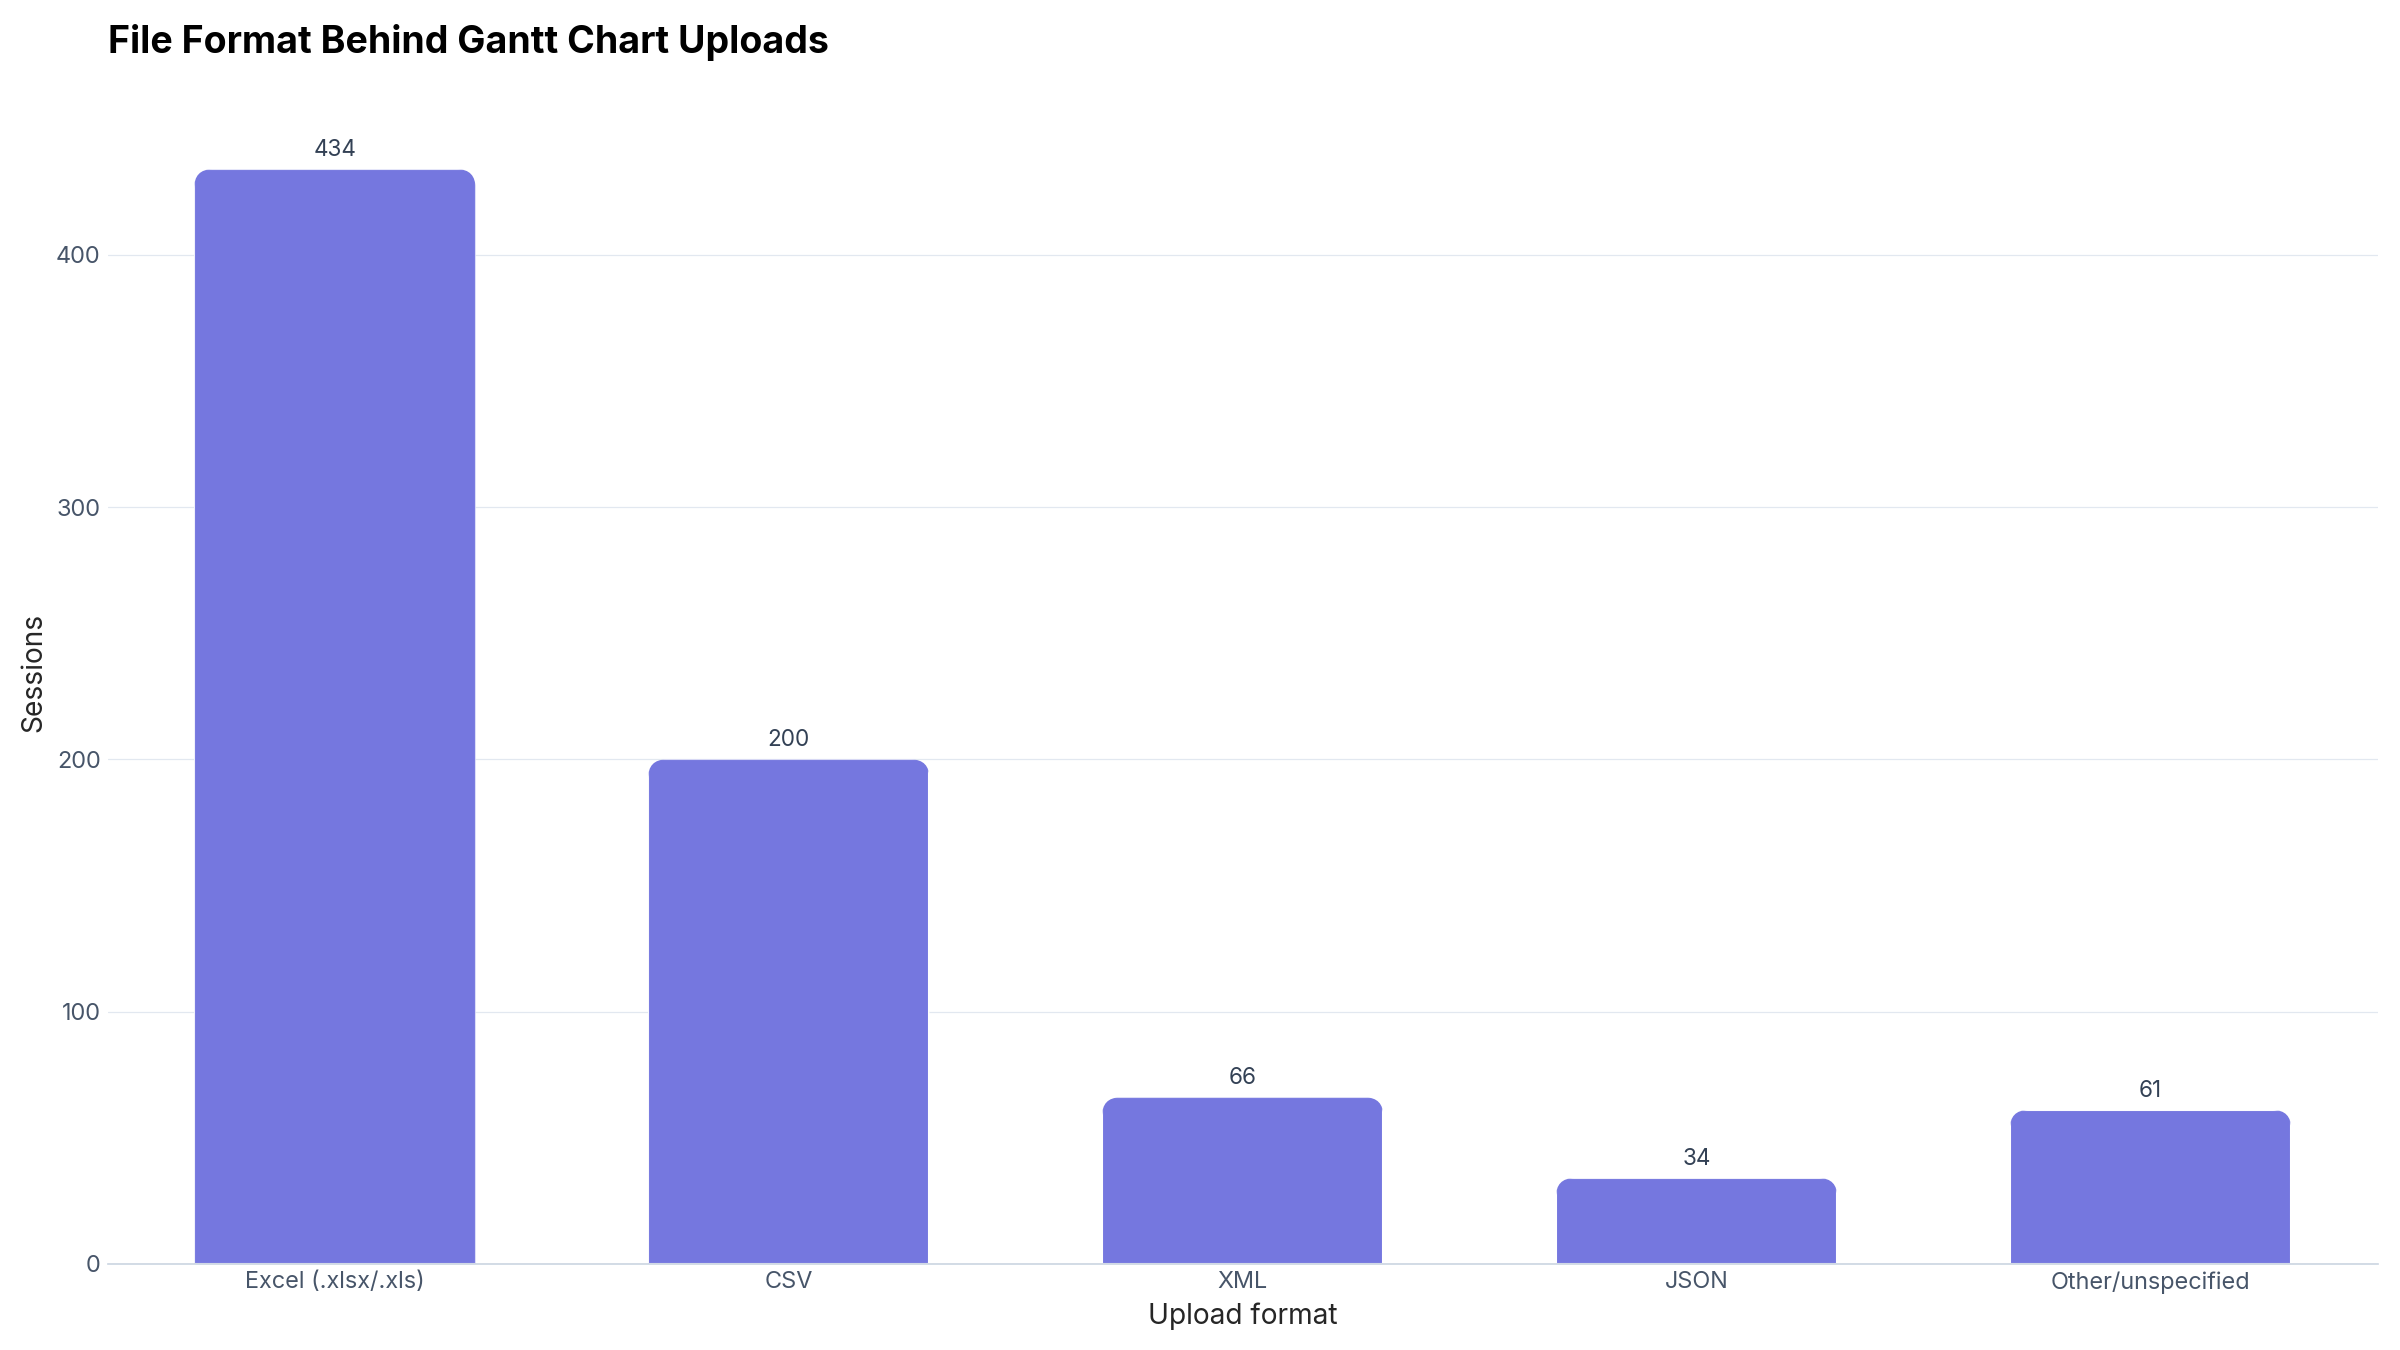
The more useful number for a Jira export specifically is how often the date columns needed fixing before the chart would render:
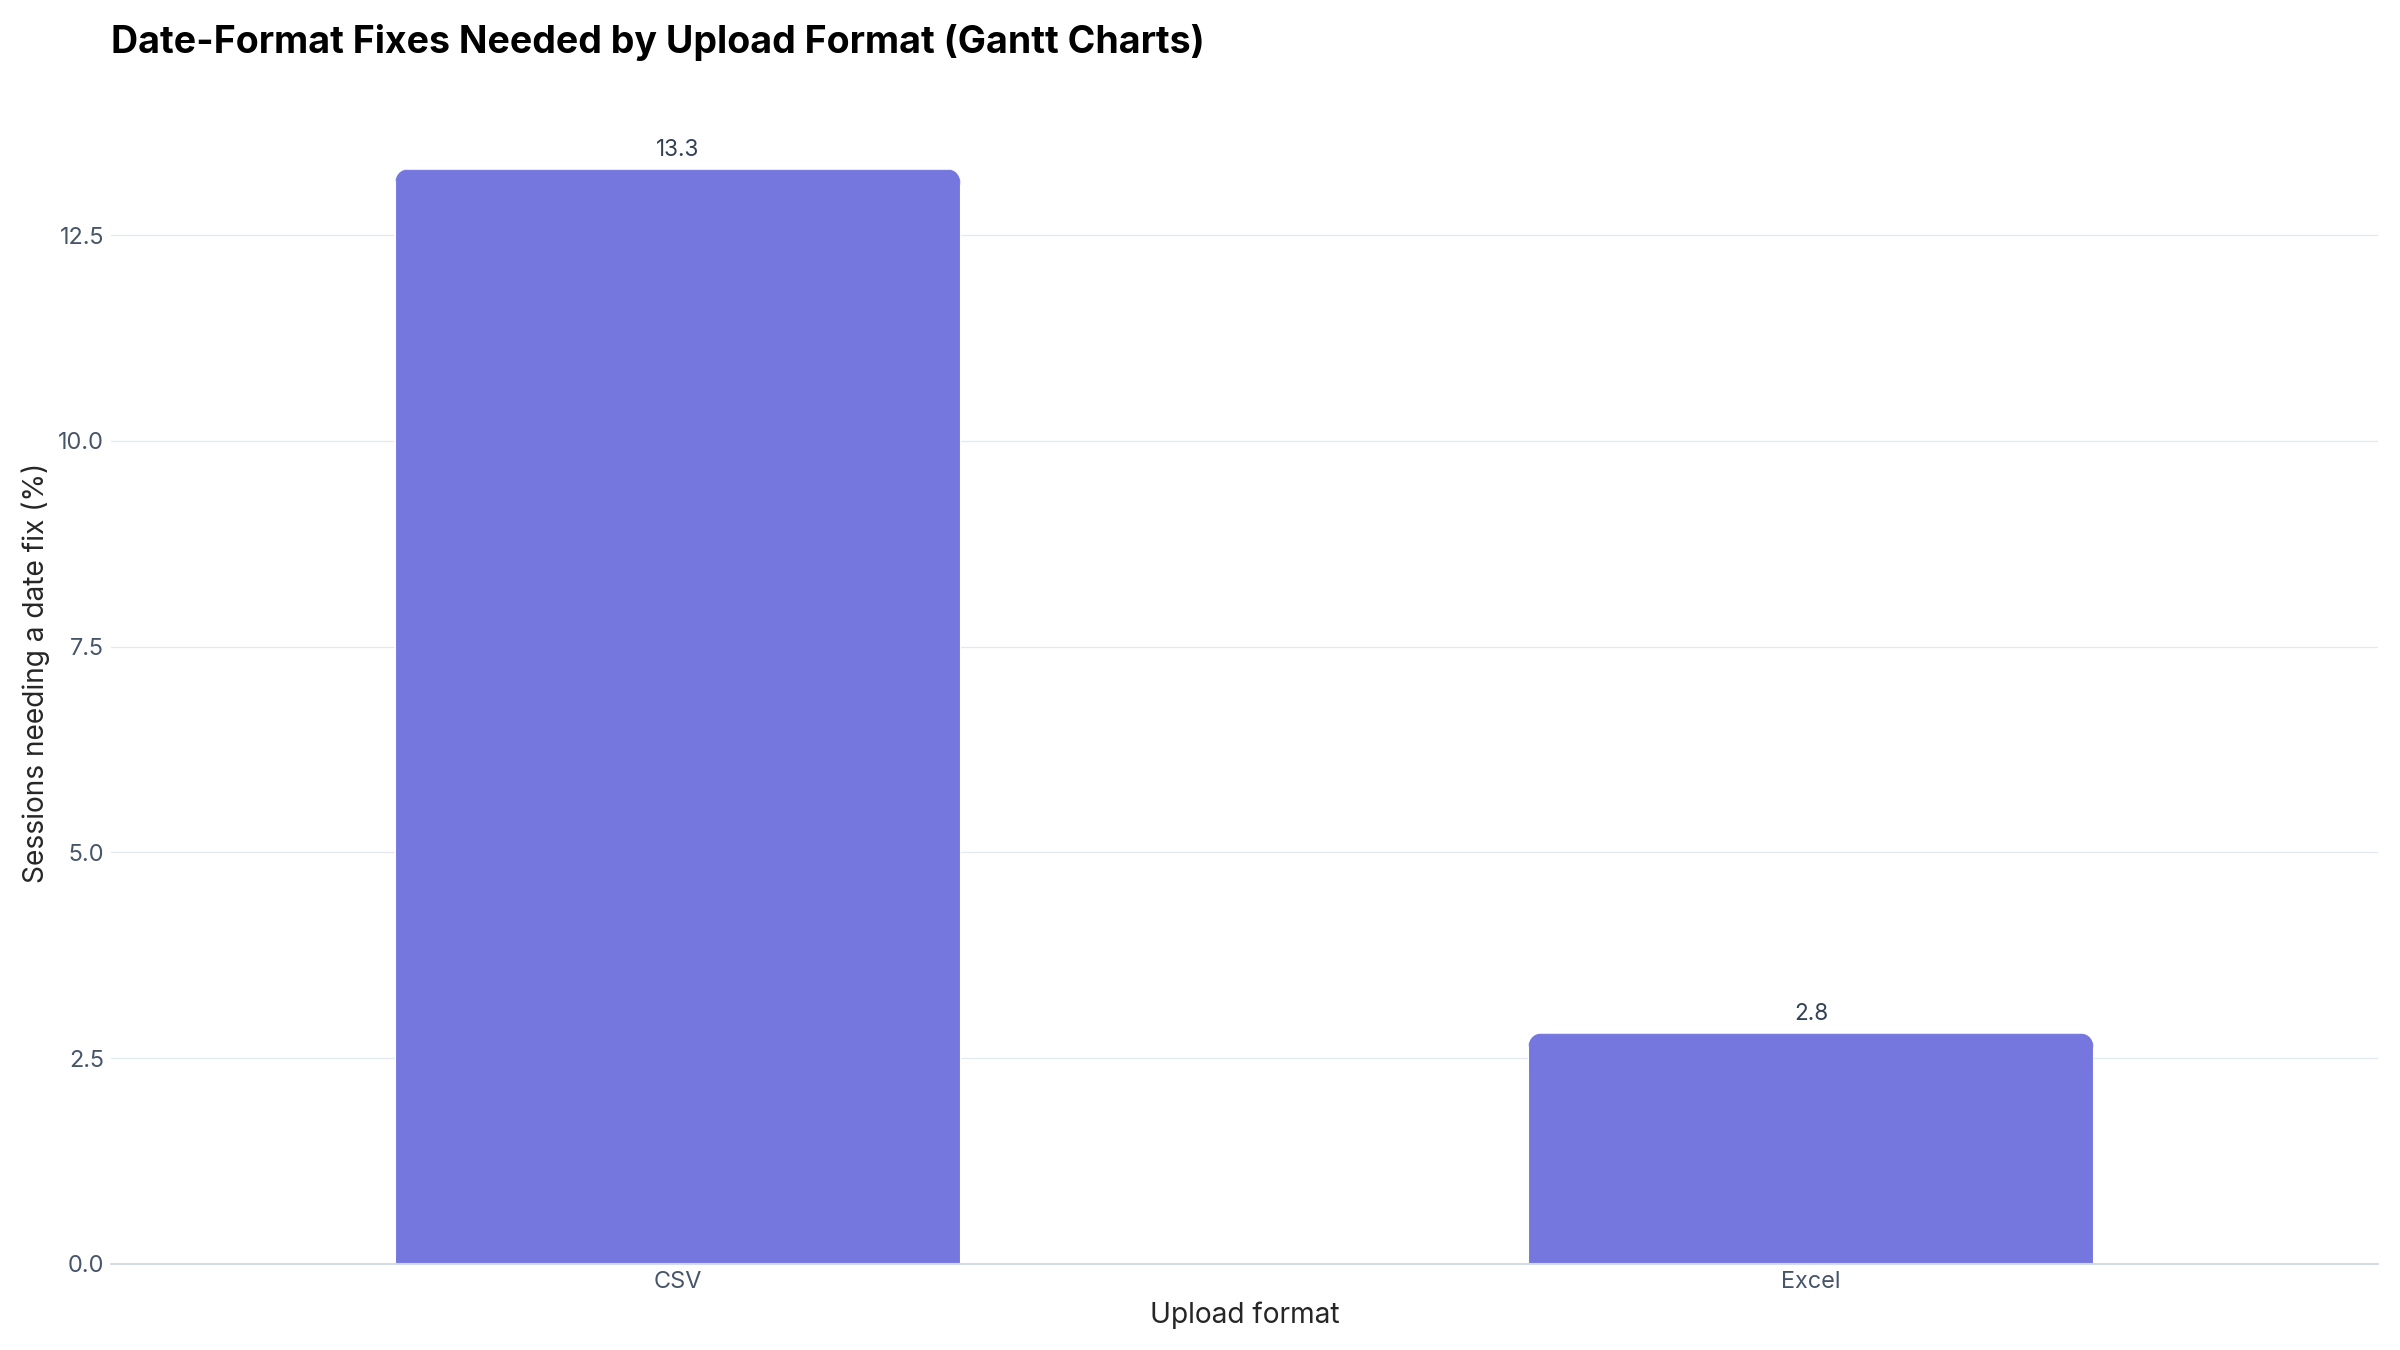
Two more data points worth stating plainly: among Gantt-chart sessions with a labeled dataset domain, project-management data was the single largest category (174 of 514 successful sessions) — well ahead of operational, CRM and finance data. And the median time from upload to a rendered Gantt chart was about 17 seconds (n = 283 successful sessions with recorded timing), Jira export included.
Common Problems With Jira Date Exports
Jira's default date format isn't ISO
Jira's CSV export commonly writes dates like 17/Jun/26 12:00 AM — day, three-letter month, two-digit year, 12-hour clock — rather than 2026-06-17. Most spreadsheet tools display this fine but some chart tools choke on it. CleanChart's automatic data cleaning parses this format (and several others) before mapping the start and end columns, so you don't need to reformat the column by hand first.
No "Start date" field at all
Standard Jira Software doesn't include a built-in start-date field the way it includes Due date. If your project has never added one, your options are: add a custom Start Date field going forward, use Created as an approximation of when work began, or derive a start date from the sprint's start (all issues in a sprint starting on the sprint's first day). None of these is wrong — pick whichever matches what the chart needs to communicate.
Epics and subtasks clutter the timeline
Exporting an entire epic's hierarchy — the epic itself, its stories, and their subtasks — produces a Gantt chart with far more rows than is readable. Filter to one level (usually stories and tasks, excluding subtasks) before exporting, or build separate charts per epic.
Unresolved issues have no end date
An issue with no due date and no resolution has nothing to plot as an end point. Either set an estimated due date in Jira before exporting, or filter the export to issues that already have one — CleanChart will otherwise treat the row as incomplete for charting purposes.
Frequently Asked Questions
Can I make a Gantt chart from Jira without Advanced Roadmaps?
Yes. Export your issues as CSV from the board or backlog, make sure a start date and due date are populated, and upload the file to CleanChart's Jira to Gantt chart converter. No Jira add-on or admin permission is required.
Does Jira have a built-in Gantt chart view?
Only through Advanced Roadmaps, a premium add-on available on Jira Software's Premium and Enterprise plans (or as a paid add-on on lower tiers). Teams without it commonly export issues and build the timeline elsewhere.
What Jira fields do I need to export for a Gantt chart?
At minimum: Summary (or Key) for the task label, a start date, and Due date. Sprint, Issue Type or Epic are useful additions for color-coding tasks by group.
Why does my Jira export not have a start date column?
Standard Jira Software doesn't ship a built-in "Start date" field. Add a custom date field to your project, or use the Created field as a stand-in for when work began.
Why do my Jira dates look wrong after uploading?
Jira's CSV export writes dates in a day/month-name/year format with a 12-hour clock (for example 17/Jun/26 12:00 AM), which some tools misread. CleanChart's automatic cleaning standardizes this before charting; if a date still looks off, check that the same column wasn't reformatted by a spreadsheet program in between.
Can I color Gantt bars by Jira sprint?
Yes — include the Sprint column in your export and map it as the grouping column. Each sprint gets its own color automatically.
Can I do this with Microsoft Project exports too?
Yes — the same CSV-export-then-upload approach works for Microsoft Project. See the Microsoft Project to Gantt chart converter for the MS Project-specific field names.
Related CleanChart Resources
Gantt Chart Tools
- Jira to Gantt Chart Converter – Upload a Jira CSV export directly
- CSV to Gantt Chart – For any CSV task list, Jira or otherwise
- Microsoft Project to Gantt Chart – Same approach for MS Project exports
- Gantt Chart Maker – Build a Gantt chart from any data
Related Blog Posts
- How to Create a Gantt Chart: Step-by-Step – The general-purpose guide
- Project Management Pie Chart & Gantt Guide – Gantt charts alongside other project visuals
- Handling Missing Values in CSV Data – What to do about blank due dates before charting
- Chart Types Explained – When a Gantt chart isn't the right choice
External Resources
- Wikipedia: Gantt Chart – History and detailed explanation of Gantt charts
- Atlassian: What Is a Gantt Chart? – Agile and Scrum perspective on Gantt charts, from Jira's own maker
- Atlassian Support: Export Issues From Jira – Official documentation for CSV and Excel export options
Last updated: September 21, 2026