A Smartsheet Gantt chart report is a Smartsheet report shown in Gantt view: it pulls rows from one or more sheets and draws them as bars on a timeline. To build one, create a report with at least two date columns, then switch it to Gantt view from the toolbar. What it won't do is tell you what the chart means. For a written status report (percent behind plan, overdue tasks, critical path, forecast finish) you export the sheet to Excel and analyze the task list. Below are both routes, with a worked example from a 13-task sample export.
We make CleanChart, so weigh our ranking accordingly. The Smartsheet steps below come from Smartsheet's own help center and work without any other tool.
How Do You Make a Gantt Chart Report in Smartsheet?
A Smartsheet report is a filtered view across sheets, and Gantt view is one way to display it. The steps:
- Check the source sheets. According to Smartsheet's Gantt view article, a sheet or report needs at least two date columns that aren't backed by column formulas. A start date and an end date are the usual pair.
- Create the report and pick the sheets and rows it should include, for example all open tasks across several project sheets.
- Add both date columns to the report, plus whatever you want to read next to the bars: % Complete, Assigned To, Status.
- Switch to Gantt view from the report toolbar, the same way you would in a sheet.
One limit to know before you promise anyone a screenshot: Smartsheet's help states that "Reports do not yet support the new Gantt view." Reports open in the legacy Gantt view, so features that only exist in the new view on sheets won't appear in the report. If you need those, show the sheet itself rather than a report.
How Do You Export a Smartsheet Gantt Chart?
Smartsheet's export article lists five formats. Which one you need depends on what the reader should do with it:
| Export format | What you get | Good for |
|---|---|---|
| Image (PNG) | The Gantt chart as a picture (Gantt view only) | A slide or an email |
| A printable version of the sheet or report | Handing out a paper copy | |
| Microsoft Excel | The task list only. Excel has no Gantt format, so the bars don't come along | Analysis, or any tool that reads a spreadsheet |
| Google Sheets | The task list as a Google sheet | Sharing with people outside Smartsheet |
| Microsoft Project (XML) | The plan as a Project file (Gantt view only) | Moving the plan to Microsoft Project |
Two details from the same article: reports exported to Excel are limited to 20,000 rows, and you need Owner, Admin or Editor permission to export. The PNG and the PDF show the schedule. Neither one says whether the schedule is in trouble. That reading is the part of a report you still have to write.
What Does a Written Report From a Smartsheet Export Show?
To show the difference, we took a sample task list shaped like a Smartsheet project sheet exported to Excel: a CRM rollout with 13 tasks, the column names Smartsheet uses (Task Name, Start Date, End Date, Duration, Predecessors, % Complete, Assigned To, Status) and predecessors written as row numbers. Everything in it is sample data, and the status date is 16 November 2026. You can download the sample export (CSV) and try it yourself.
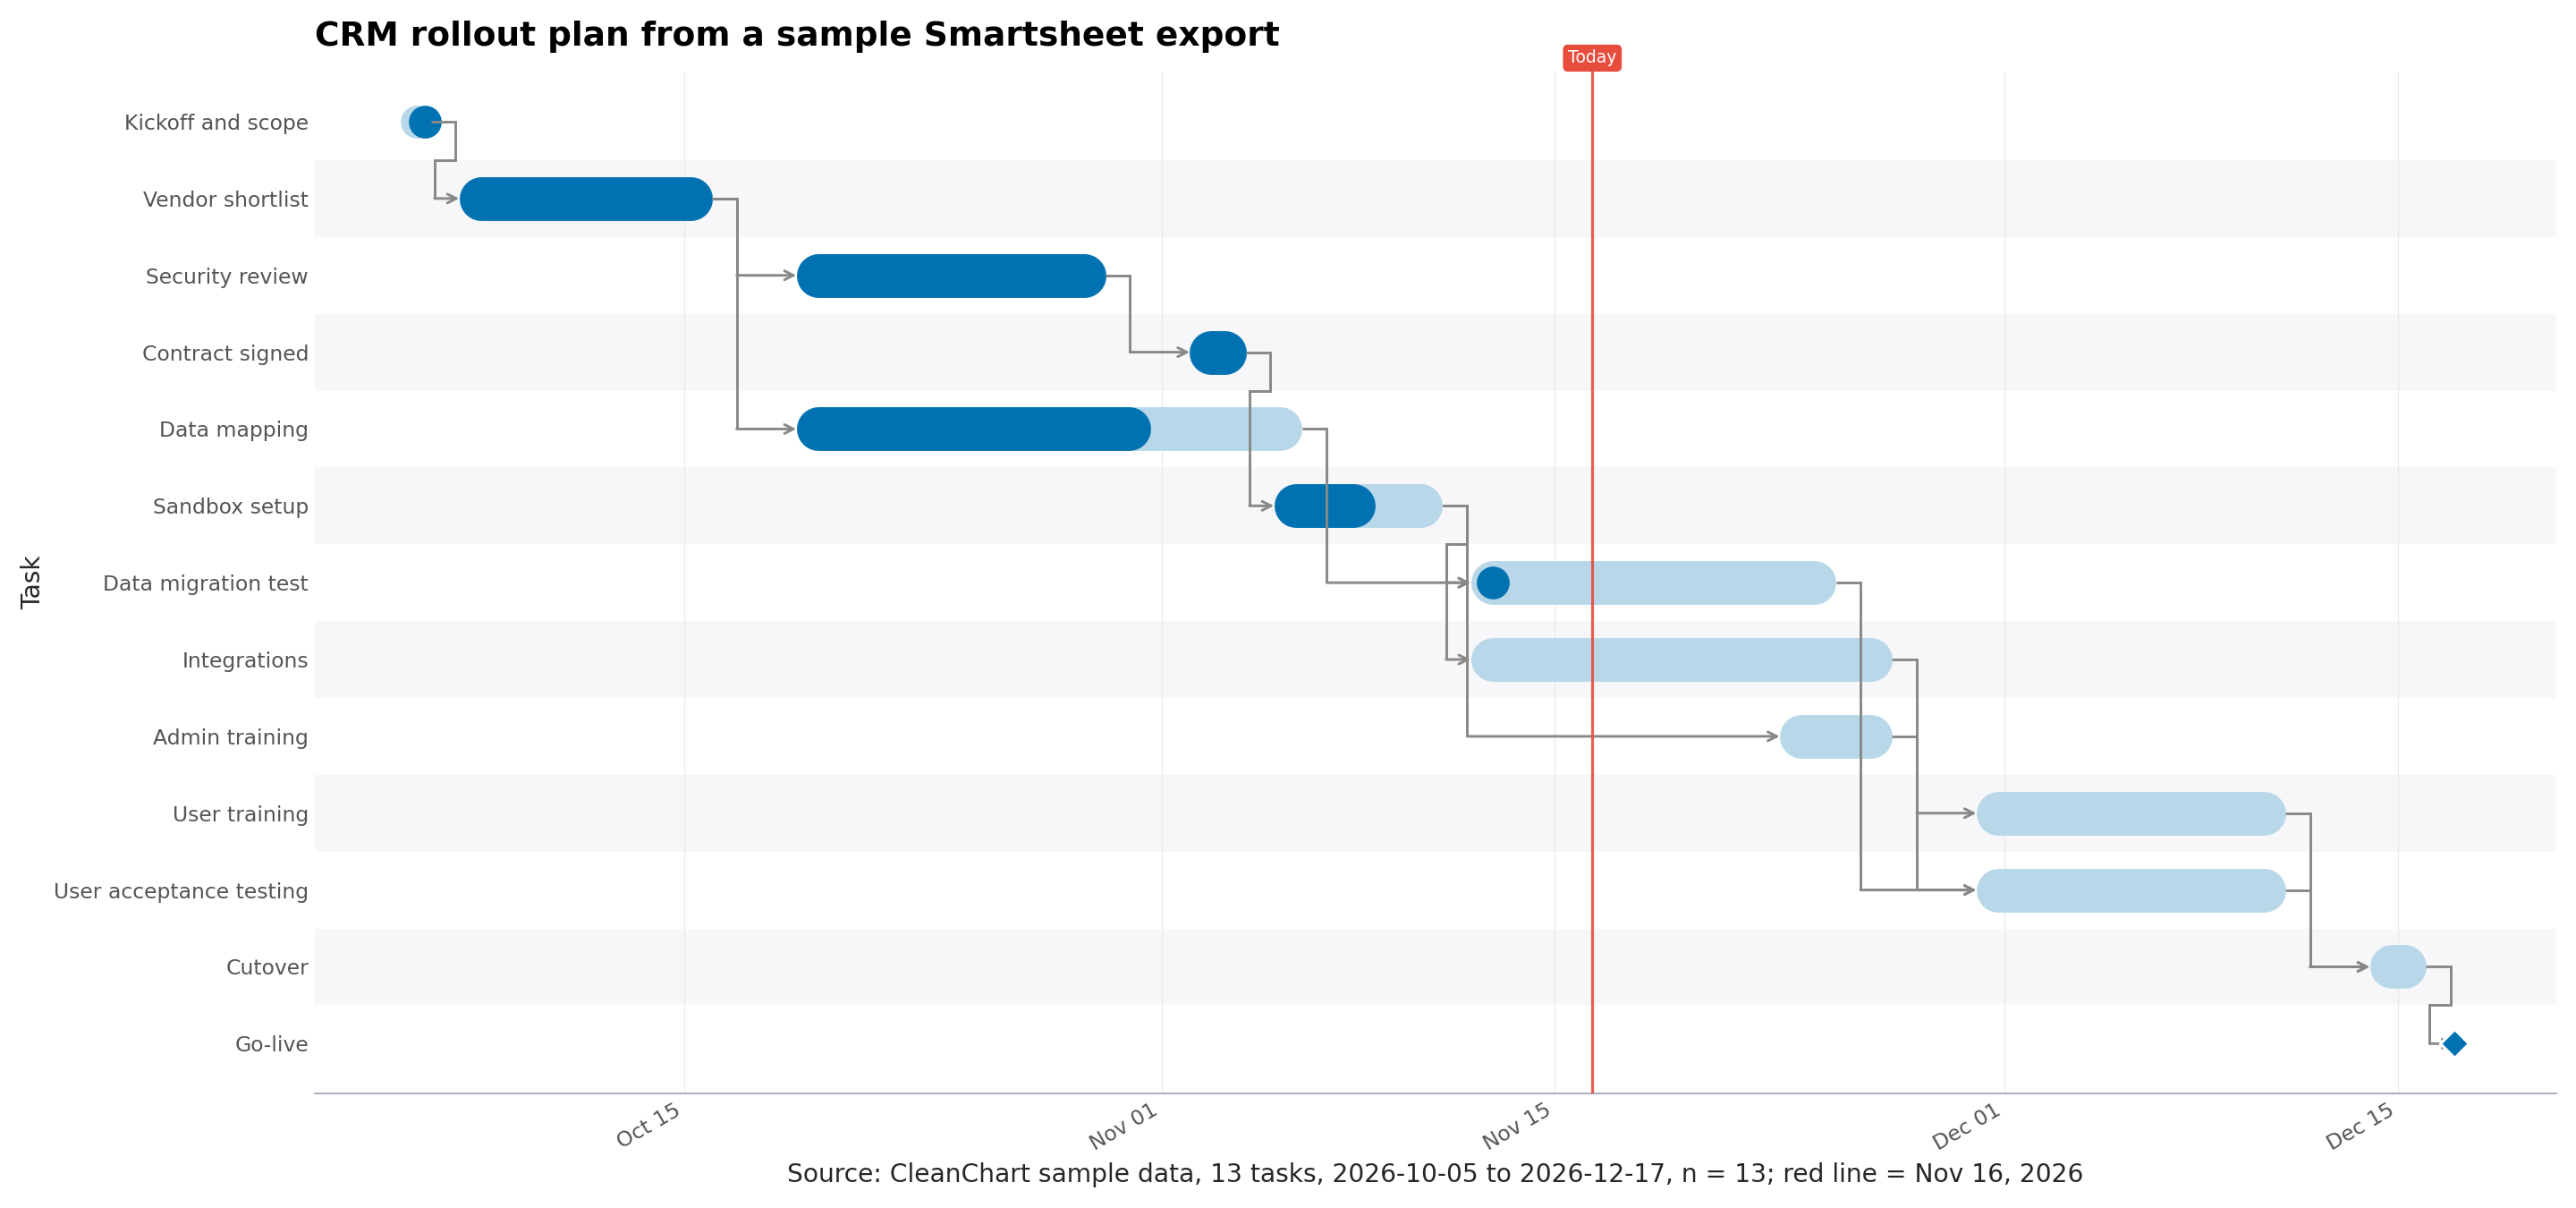
The chart alone suggests a plan that is roughly on track, with a few bars running long. We then ran the same rows through CleanChart's project report engine. It gave the plan a Red status and returned 10 findings. The page-1 figures:
- 40% complete where the plan expected 53% by the status date, so 12 points behind.
- 2 tasks overdue: Data mapping and Sandbox setup are past their end date and not marked done.
- Forecast finish Jan 11, 2027 instead of the planned Dec 17, 2026.
The five findings rated high, quoted as the engine returned them:
- "At your current pace, the end date slips by about 17 working days." Work is progressing at 77% of the planned pace.
- "7 tasks decide your end date — none has a single day of slack." The critical path runs through Sandbox setup, Integrations, Admin training, User training, User acceptance testing, Cutover and Go-live.
- "1 task on the critical path is behind plan by up to 25 points." Integrations is 0% done, 25 points behind its elapsed time.
- "2 tasks are overdue."
- "The project is 12 points behind plan."
The medium findings are the ones a glance at the bars misses. Sandbox setup blocks 3 other tasks. One person is responsible for 3 of the 6 critical tasks (the engine doesn't count the Go-live milestone as a task here). Data migration test is 2 working days of slack away from becoming critical. And Go-live follows the last task with 0 working days of buffer. Each finding comes with a recommendation; for the slip, it's to decide now whether to recover the pace or move the end date, and to tell stakeholders the forecast.
For the full layout of such a report (one-page brief, critical path page, workload, appendix) see the 8-page sample project report (PDF), made from a different sample plan.
How Do You Turn the Export Into a Status Report?
- Export the sheet, not a report, to Excel. Smartsheet predecessors are row numbers in the source sheet (Smartsheet's dependency article describes typing the row number of the task that must come first). A report can filter or re-sort rows, so those numbers can end up pointing at the wrong task.
- Deal with parent rows. If your sheet groups tasks under parent rows and they show up in the export as ordinary rows, the report reads each one as a task. In our test, a parent row spanning the whole project was read as one long task: it raised the slip from 17 to 19 working days and added a finding that "1 task holds 37% of all planned work". The fix: insert a column named ID, number the rows 1, 2, 3 in sheet order, then delete the parent rows. The engine matches predecessor numbers against an ID column, so the numbers keep pointing at the right tasks, and the findings matched the flat file exactly.
- Upload the file to the Excel to Gantt chart converter and check the column mapping: Task Name, Start Date, End Date, and Predecessors as the dependency column if you want the critical path. % Complete feeds the status section, and an owner column such as Assigned To adds workload by person.
- Open the report preview. It's free and shows your own numbers: the number of findings, the key figures and the top finding in full.
- Get the report. Reports are included in the Deadline Pass ($4.99 for 7 days) and in Pro ($19 a month). You download a PDF and the same report as an editable Word file (.docx) and a PowerPoint deck (.pptx). The Gantt chart itself stays free with a watermark.
The limits: at least 5 tasks with calendar dates and no more than 2,000 rows. Predecessors with a type or lag are treated as finish-to-start and listed in the data notes. The page-1 summary is written by the Claude API from the computed findings, never from your raw rows, and owner names are replaced with placeholders before that call.
Which Route Should You Use?
| Smartsheet report in Gantt view | Smartsheet PNG or PDF export | CleanChart project report | |
|---|---|---|---|
| Stays current | Yes, live as the sheets change | No, a snapshot | No, upload a new export each time |
| Combines several sheets | Yes | Only what the report shows | Only if they're in one exported file |
| Written analysis | No, you write it | No, you write it | Yes: ranked findings, recommendations and a summary |
| Forecast finish and % behind plan | No | No | Yes, when the file has % Complete or Status |
| Gantt view | Legacy view only in reports | As displayed in Smartsheet | CleanChart's own Gantt chart |
| Limits | Smartsheet plan and permissions | Owner, Admin or Editor to export | 5 to 2,000 rows, calendar dates; it's a PDF, Word and PowerPoint file in English |
| Cost | Part of your Smartsheet plan | Part of your Smartsheet plan | Deadline Pass or Pro; preview free |
If your stakeholders log into Smartsheet, a live report in Gantt view is the better tool: it never goes stale. If they want a document that says where the project stands and what to decide, a snapshot with written findings serves them better, and that's the gap the export route fills. Many teams use both: the live report for the team, the PDF for the steering meeting.
Frequently Asked Questions
Can a Smartsheet report show a Gantt chart?
Yes. A report with at least two date columns that aren't formula-backed can be switched to Gantt view from the toolbar. Reports currently use the legacy Gantt view, not the new one.
Does exporting a Smartsheet Gantt chart to Excel keep the bars?
No. Smartsheet exports only the task list to Excel, because Excel has no Gantt format. Use the PNG export for the picture, or rebuild the chart from the exported list.
Why do my dependencies break after exporting a report?
Predecessors in Smartsheet are row numbers in the source sheet. A report filters and sorts rows, so the numbers can point at the wrong task. Export the sheet itself, or add an ID column with the original row numbers before removing rows.
How do I show the critical path from a Smartsheet export?
Map the Predecessors column as the dependency column when you upload the Excel file. The project report then lists the tasks with no slack and the ones within a few working days of becoming critical.
Is the report free?
The preview is free and shows your own key figures and top finding. The full report (PDF, Word and PowerPoint) is included in the Deadline Pass ($4.99 for 7 days) and in Pro ($19 a month).
Related CleanChart Resources
Tools
- Excel to Gantt Chart Converter – Upload the Smartsheet export and open the report preview
- Gantt Chart Maker – Build the chart from any task list
- How CleanChart reports work – Project and data reports side by side
Related Blog Posts
- Gantt Chart Report: Example and How to Make One – What a Gantt chart report should contain, page by page
- How to Turn a Jira Export Into a Gantt Chart – The same export route for Jira
- Project Status Report Excel Template (Gantt) – A template if you'd rather write the report yourself
External Resources
- Smartsheet Help: Create and work with a Gantt view – Requirements and the legacy view in reports
- Smartsheet Help: Export a sheet, report, workspace, or folder – Formats, permissions and row limits
- Smartsheet Help: Enable dependencies and use predecessors – How predecessor row numbers work