A Gantt chart for report writing is a timeline of every step between "topic agreed" and "report submitted", one bar per task, ordered so each step starts after the one it depends on. For a typical research or project report that means five phases: plan, research, draft, review and submit. Below is a 14-task sample schedule you can download as a CSV, the chart it produces, and what an automated check of that schedule found five weeks in.
The chart and the check were made with CleanChart. We make CleanChart, so weigh our ranking accordingly. The schedule itself works in any tool, including Excel.
What Does a Gantt Chart for Report Writing Show?
It shows when each part of the report gets done and which parts wait on others. The horizontal axis is the calendar, each row is a task, and arrows connect a task to the one it unlocks. Read top to bottom, the chart is the order of work. Read left to right, it's the deadline pressure.
Writers use it for three different jobs, and the columns you need differ for each:
- Planning a thesis, dissertation or long report. Supervisors and course handbooks often ask for a timeline in the proposal. Task names and start and end dates are enough.
- Tracking your own progress. Add a percent-complete column and the chart shows how far each bar is filled, so a slipping literature review is visible before it eats the drafting weeks.
- Reporting progress to someone else. A progress report to a supervisor, client or manager uses the chart as evidence for "on track" or "behind". Dependencies make that claim checkable.
Which Tasks Belong in a Report-Writing Schedule?
Break the report into tasks small enough that you'd notice within a week if one stalled. A work breakdown along these lines fits most academic and business reports:
| Phase | Typical tasks | What it waits on |
|---|---|---|
| 1 Plan | Agree topic and scope, write the outline, get the outline approved | Nothing; this is the start |
| 2 Research | Literature or background notes, data collection, analysis and charts | An approved outline for data collection; the topic for reading |
| 3 Draft | Introduction and method, results and discussion, conclusion and abstract | Results need finished analysis; the method section can start earlier |
| 4 Review | Feedback on the full draft, revisions, references and formatting | A complete draft |
| 5 Submit | Proofread, submit | Revisions done |
Two habits make the chart honest. First, give review steps that depend on another person (a supervisor reading your draft, a client signing off) their own row and owner, because you don't control how long they take. Second, write the abstract and conclusion late. They summarise results you don't have yet, so scheduling them early only creates rework.
Example: A 14-Task Report-Writing Gantt Chart
This sample schedule plans a research report from 5 October 2026 to submission on 4 January 2027. It has 14 tasks in the five phases above, a dependency for every task after the first, percent complete per task and an owner (writer or supervisor). All of it is sample data, recorded as of 13 November 2026, the red line in the chart.
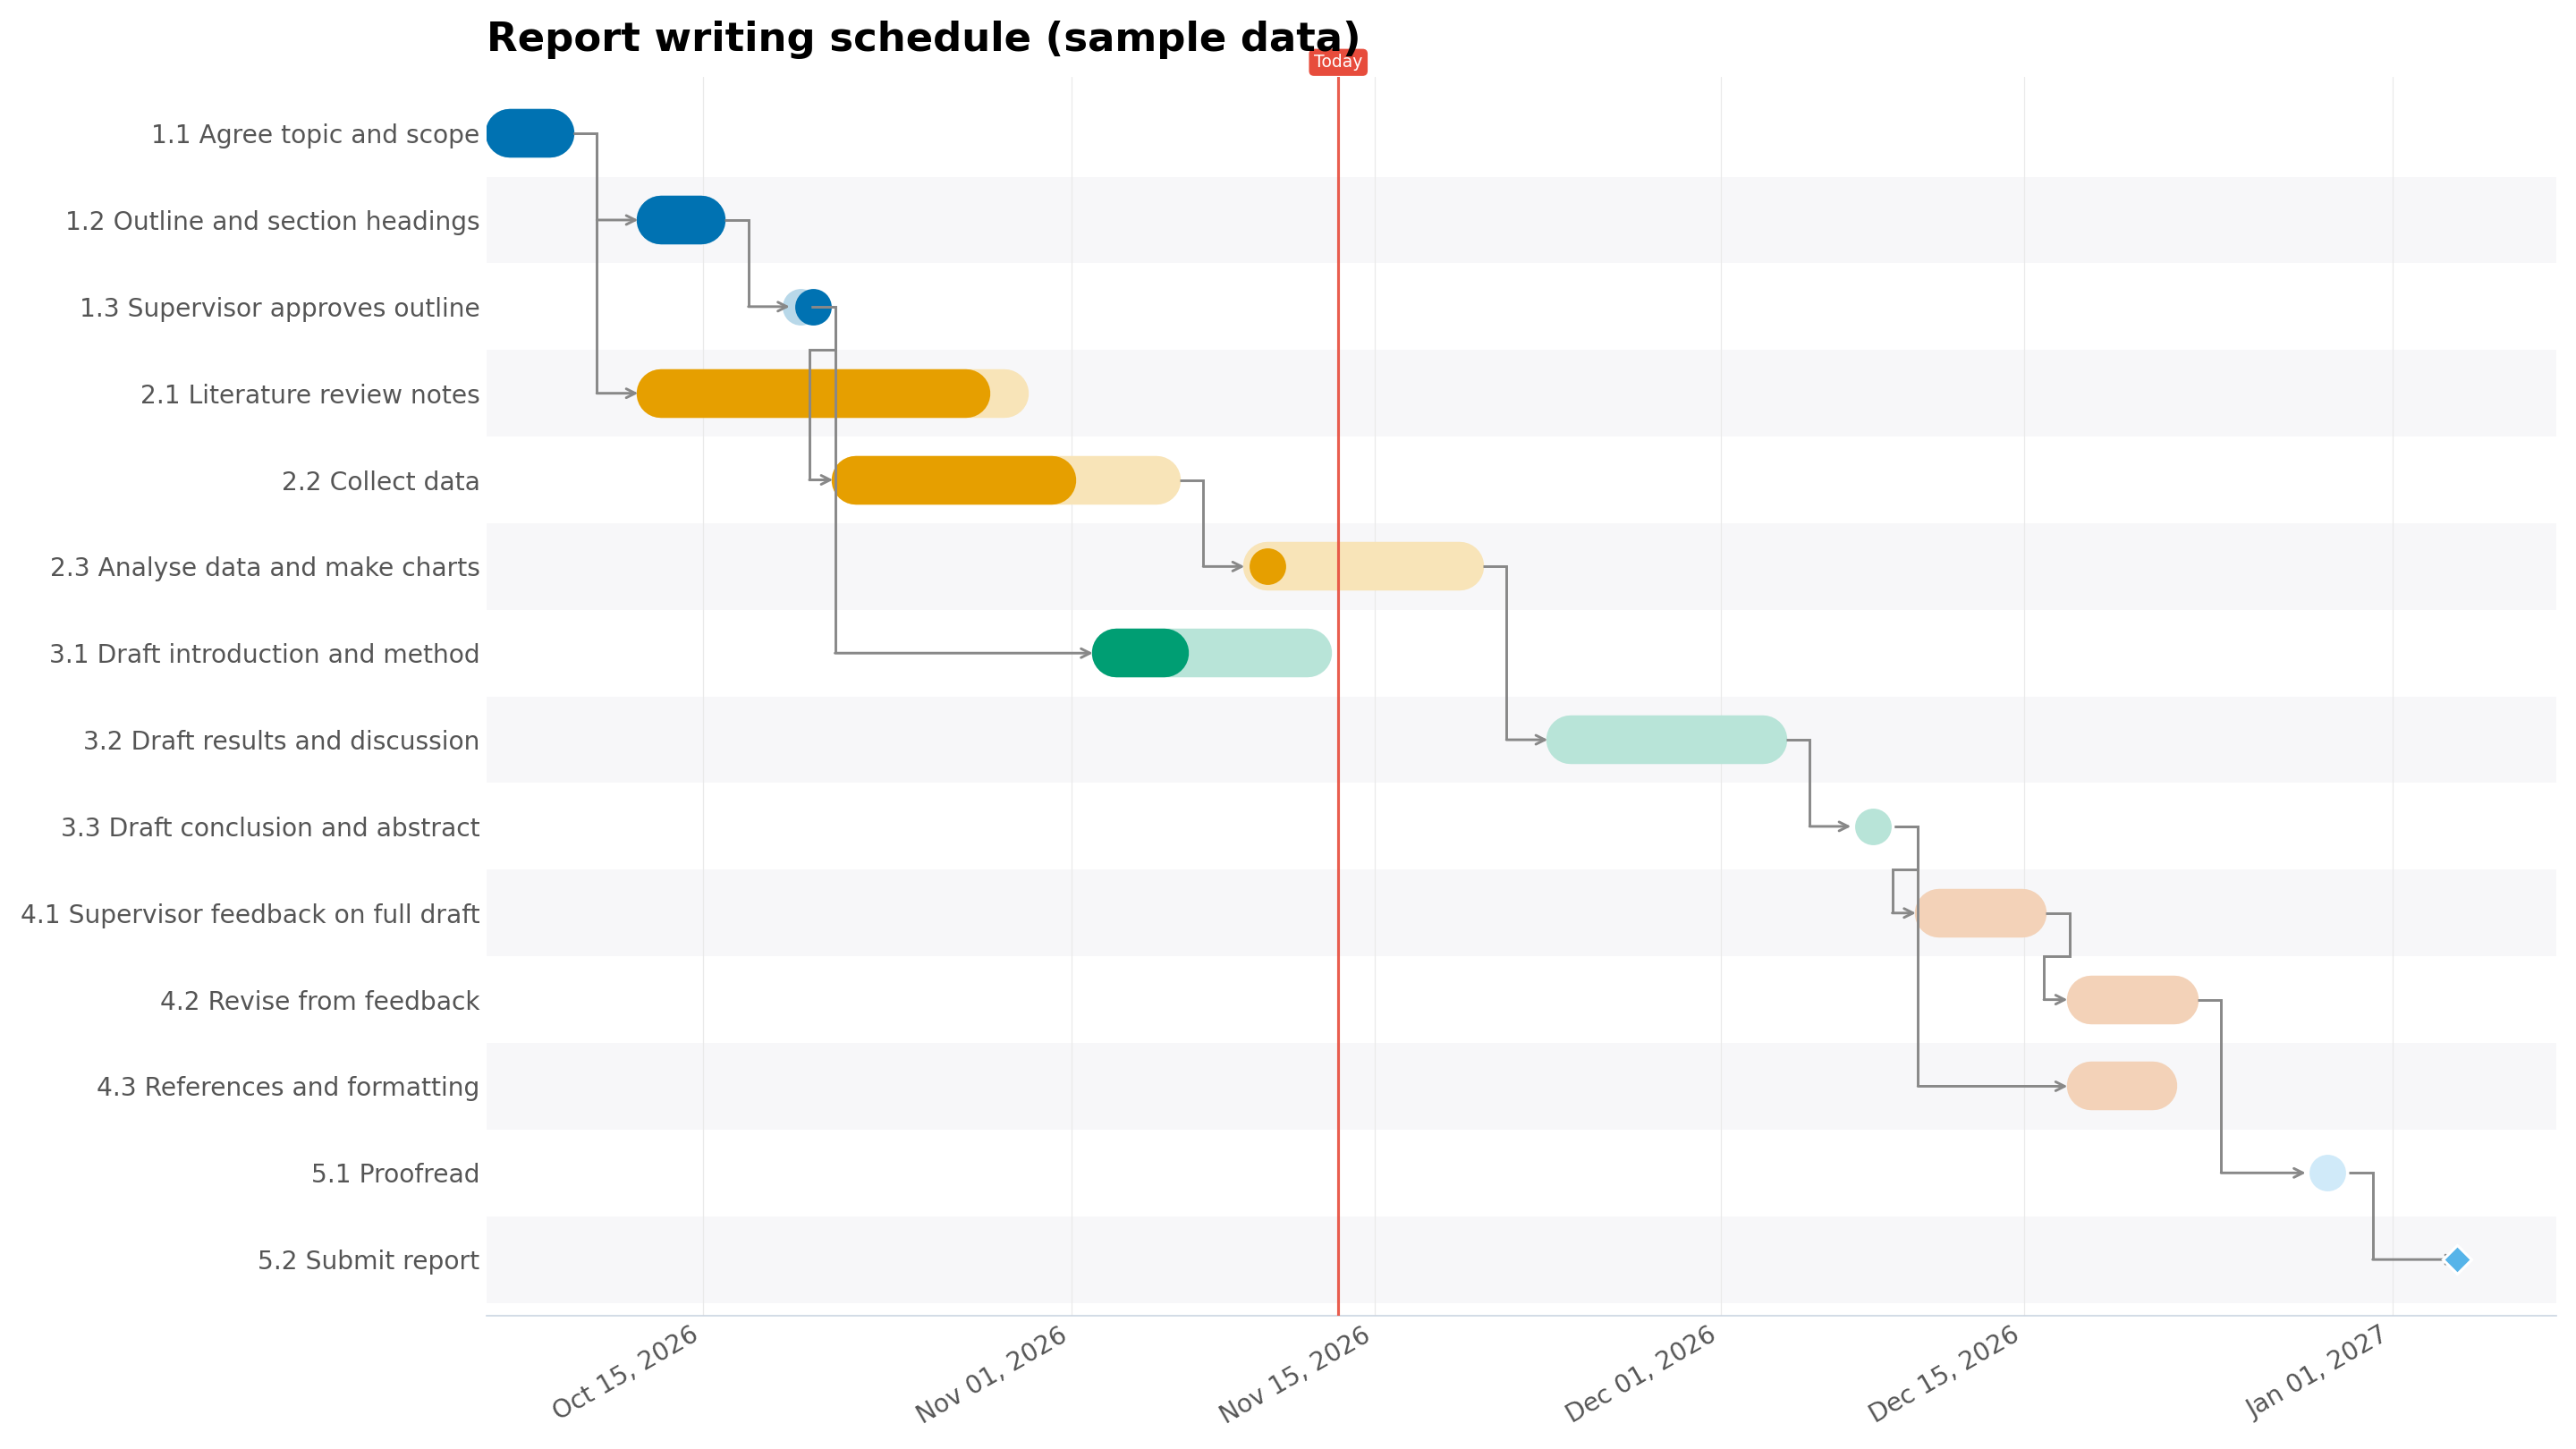
A few things are visible at a glance. The planning phase is done. The literature review and data collection bars end before the today line but aren't fully filled. Drafting the introduction overlaps with research, which is deliberate: the method section doesn't need results. Everything from "Draft results and discussion" onward hangs off one chain of arrows that ends at the submission diamond.
The CSV has seven columns: Phase, Task, Start, End, Depends, Progress and Owner. Open it in Excel, replace the tasks and dates with yours, and keep the Depends column pointing at the exact task names.
What Did a Schedule Check Find in This Plan?
We ran the sample file through the engine behind CleanChart's project report, with 13 November 2026 as the report date. It returned 8 findings, 3 of them high severity, and rated the plan red: "17 points behind plan · 2 overdue tasks". These are its findings as returned, on sample data:
| Severity | Finding (verbatim) | What it means for a writer |
|---|---|---|
| High | At your current pace, the end date slips by about 26 working days | Progress is at 72% of the planned pace; at that rate submission lands around 9 Feb 2027, not 4 Jan 2027 |
| High | The project is 17 points behind plan | 44% of the work is done; the plan expected 61% by this date |
| High | 1 task decides your end date — none has a single day of slack | Only the submission itself is critical; the 2 working days between proofreading and submission give every earlier task a little slack |
| Medium | 2 tasks are overdue | Literature review notes and data collection are past their end dates and not marked done |
| Medium | 7 more tasks are within 5 working days of becoming critical | Proofreading has 2 working days of slack; analysis, both later drafts, supervisor feedback and revisions have 4 |
| Low | Only 2 working days of buffer before your final milestone | Proofreading ends 2 working days before submission |
| Low | One week has 3 tasks running in parallel — 1.8× your average | The week of 19 October stacks outline approval, reading and data collection |
| Low | 2 consecutive phases overlap by 15 working days | Drafting starts while research is still running |
Two of these are worth acting on in any report plan. The forecast slip comes from comparing elapsed time with percent complete, and it's the number that tells you to cut scope or ask for an extension now rather than in December. The near-critical list matters because a report schedule is mostly one long chain: analysis feeds results, results feed the conclusion, the conclusion feeds review. The 4 working days of slack on each link is shared, so losing it once uses it up for everything downstream.
The engine also flagged the two tasks furthest behind their elapsed time: "Draft introduction and method" (40% done on its last scheduled day) and "Analyse data and make charts" (10% done after a week). Those are the tasks to talk about at the next supervisor meeting.
How Do You Make One From a Spreadsheet?
- List the tasks. Start from the phase table above. One row per task, with a Phase column if you want the bars grouped.
- Add dates. Use calendar dates in one format throughout (2026-10-05 is safest). Work backwards from the submission deadline and leave a buffer before it.
- Add dependencies. In a Depends column, name the task each row waits for, exactly as written in the Task column.
- Add progress and owner once work starts, if you want to track it or report on it.
- Upload the file. Save it as .xlsx or .csv and upload it to the Excel to Gantt chart converter or the CSV to Gantt chart converter. Check that Task, Start, End, Depends and Progress are mapped to the right columns.
- Export. A free export is a watermarked PNG at reduced resolution. Clean high-resolution PNG and SVG, and PDF, need a paid plan.
If you'd rather build the chart in Excel itself, the stacked bar method in our guide to creating a Gantt chart step by step covers it. Dependency arrows are the part Excel's stacked bars can't draw.
Getting the schedule check for your own plan
After the Gantt chart renders, the chart builder offers a project report when the file qualifies: at least 5 tasks with calendar dates and at most 2,000 rows. Plans written as "Week 1" or "Sprint 3" get no offer. The teaser (number of findings and key figures) and a blurred preview of page 1 are free. The full report comes with the Deadline Pass ($4.99 for 7 days) and with Pro ($19 a month); it isn't sold separately.
The report is a PDF in English, with the same report as an editable Word file (.docx) you can paste into your thesis, and as a PowerPoint deck (.pptx). In the preview you can set the title, a "Prepared by" line and who the written summary is for, with thesis among the options. Page 1 is a one-page brief with KPI tiles, the top 3 findings and a written summary. The sample project report (PDF) shows the full layout, and how CleanChart reports work lists what each section needs.
How Do You Put a Gantt Chart Inside a Progress Report?
If the report you're writing is itself a progress report, the Gantt chart usually goes in the "work completed" or "work scheduled" section. A chart dropped under a heading with no text around it leaves the reader to do the interpretation, so frame it:
- One sentence before it saying what the chart covers and the as-of date, for example "Figure 2 shows the schedule as of 13 November; filled portions show completed work."
- One or two sentences after it naming what changed since the last report and what it means for the deadline. In the sample above, that's the two overdue research tasks and the forecast slip.
- A caption with the source and the number of tasks, so the reader knows the chart is complete.
- Landscape orientation if the task names are long. A Gantt chart squeezed into a portrait column loses its labels first.
Keep the chart to the tasks the reader cares about. A supervisor needs the phases and the late tasks; the full 40-row plan can go in an appendix. Our post on the Gantt chart report walks through a complete status report page by page if you need the longer format.
Excel, a Template Site or CleanChart: Which Should You Use?
| Option | Pros | Cons |
|---|---|---|
| Excel stacked bar chart | Free if you already have Excel; full control over layout; the schedule and chart live in one file | No dependency arrows; progress shading and a today line take manual work; you rebuild the formatting each time dates shift |
| Online diagram template (Creately, TomsPlanner and similar) | Ready-made report-writing layouts; drag bars by hand; good for a one-off proposal timeline | You draw the schedule rather than generate it from a task list; no check of progress against plan |
| CleanChart | Draws bars, groups, dependency arrows, progress and a today line from your spreadsheet; optional project report with forecast, critical path and overdue tasks | Free exports are watermarked and reduced resolution; the report and clean exports are paid; needs calendar dates; uploads are processed on CleanChart's servers, not on your device |
For a proposal timeline you'll show once, a template or Excel is enough. For a schedule you'll update and report on every couple of weeks, generating the chart from the spreadsheet saves redrawing it each time.
Frequently Asked Questions
How detailed should a Gantt chart for a thesis or dissertation be?
Detailed enough that each task takes between a few days and three weeks. Longer tasks hide slippage; a "Write chapter 2" bar spanning two months tells you nothing until it's late. The sample above covers a full report in 14 rows.
Should a report-writing Gantt chart include supervisor feedback?
Yes, as its own task with the supervisor as owner. Feedback time is outside your control and often longer than expected, and giving it a row makes that dependency visible to both of you.
Can I make a Gantt chart for report writing in Word?
Word can hold a chart pasted from Excel or an image exported from another tool, but it isn't a good place to build one, because every date change means redrawing. Keep the schedule in a spreadsheet and insert the exported image into the document.
What date format should the schedule use?
One format for every row, ideally year-month-day such as 2026-10-05. CleanChart's cleaning step normalises mixed date formats, but a consistent column avoids misread days and months.
How much buffer should I leave before the submission deadline?
There's no fixed rule, but plan some on purpose rather than leaving whatever is left over. In the sample, the plan left only 2 working days after proofreading and the check flagged it. Buffer doesn't fix a pace problem, though: the same check forecast a 26-working-day slip, which only cutting scope or moving the date would cover.
Related CleanChart Resources
Tools
- Excel to Gantt Chart Converter – Upload the schedule and open the report preview
- CSV to Gantt Chart Converter – The same flow for the sample CSV
- Gantt Chart Maker – Options for bars, groups and dependencies
Related Blog Posts
- Gantt Chart Report: Example and How to Make One – A full sample project report, page by page
- Project Status Report Excel Template – A status template with progress columns
- How to Create a Gantt Chart: Step-by-Step – Building the chart in Excel or CleanChart
External Resources
- Wikipedia: Gantt chart – History and anatomy of the chart
- Wikipedia: Critical path method – How slack and the critical chain are calculated
- Wikipedia: Work breakdown structure – Splitting a project into schedulable tasks