Excel to PowerPoint
Excel to PowerPoint: a deck of charts and findings from your spreadsheet
Upload an .xlsx or .xls file. CleanChart cleans the data, works out what stands out and builds a PowerPoint deck from it: one slide per chart, the main finding as the slide title and the next step beside it. Your first chart is free.
Upload your Excel file to start
- Free chart first
- No signup
- No stored copy of your rows
The report and the deck have a free preview and come with the Deadline Pass ($4.99) or Pro.
From one Excel file
An editable PowerPoint deck
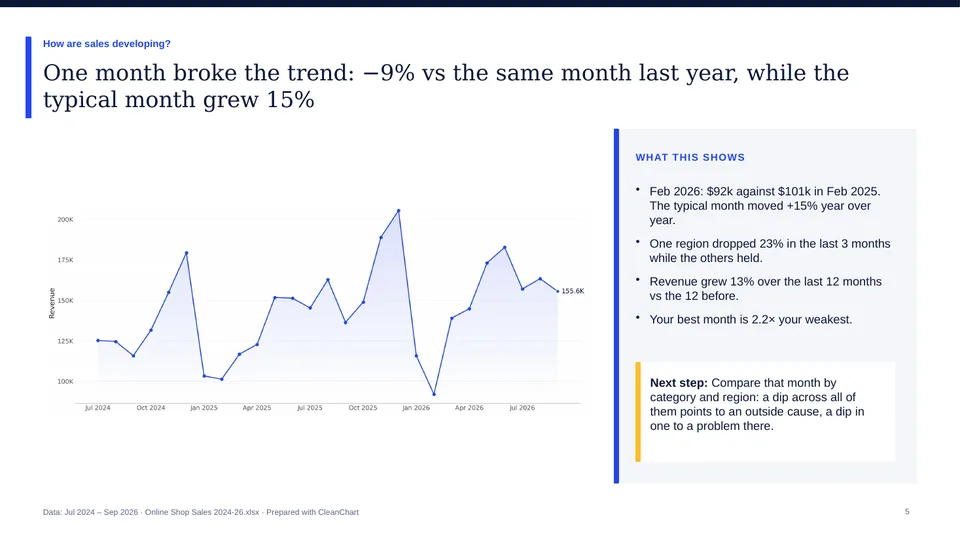
A cover, a summary with the key figures, the top 3 findings and one slide per chart. Titles, text and tables can be edited in PowerPoint.
The full report behind it
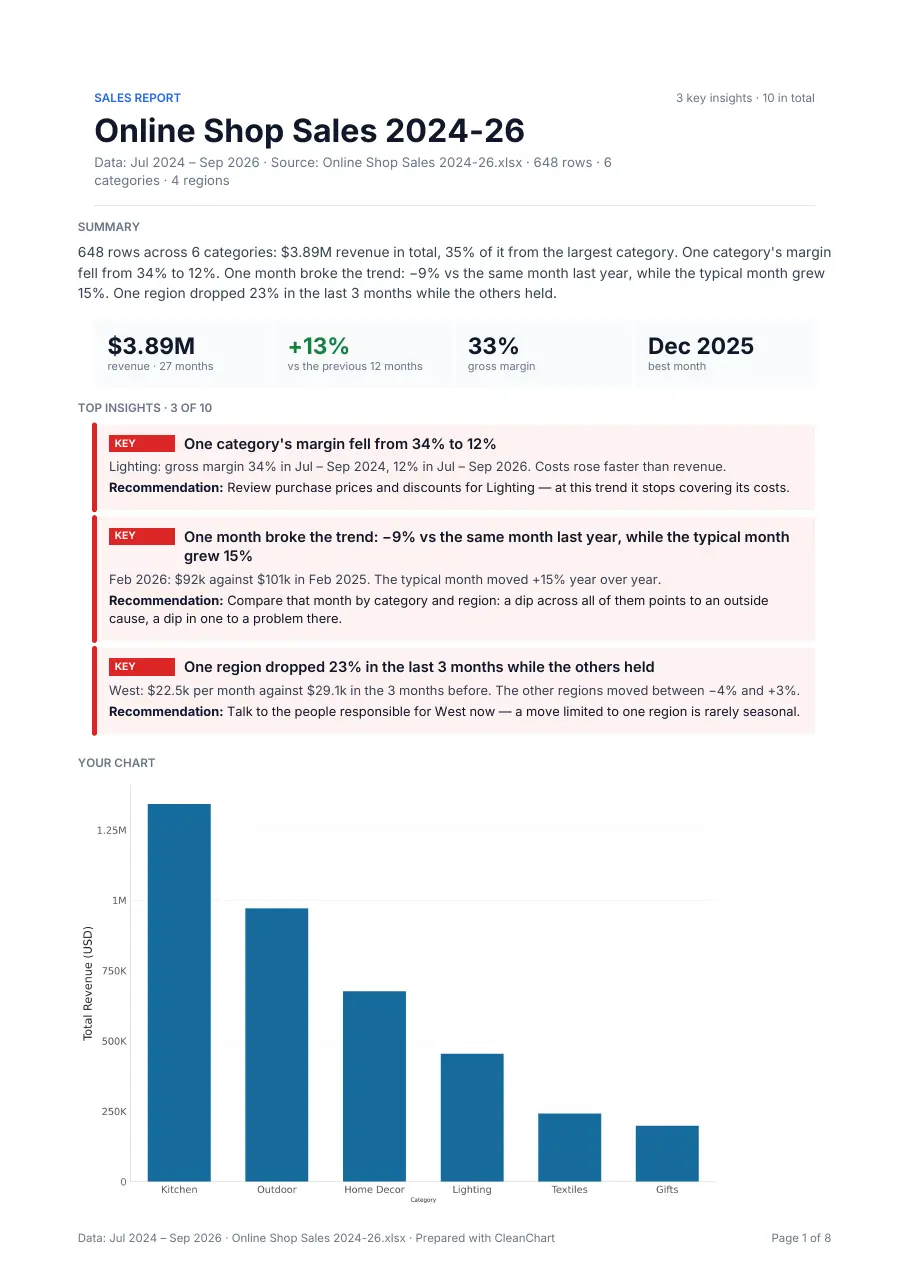
The same analysis as a multi-page PDF and an editable Word file: every finding with its impact and a recommendation.
A free chart to start
The first chart from your file costs nothing and needs no account. It carries a small watermark until you buy a pass.
How to turn an Excel file into PowerPoint slides
- 1
Upload the Excel file
Drop in an .xlsx or .xls file of up to 2 MB with one header row. If the workbook has several sheets or tables, you choose which one to use.
- 2
Check the first chart
Date formats, type mismatches, duplicates and missing values are cleaned automatically, and a fitting chart appears within seconds. You can switch the chart type.
- 3
Open the free report preview
For files with 10 to 20,000 rows and enough findings, the preview shows page 1 of the report: key figures, the top finding in full and how many more there are.
- 4
Download the deck
The .pptx comes with the report in the Deadline Pass ($4.99, one payment, 24 hours) or Pro ($19 a month). Before you generate it, pick the questions it answers and set the title and a 'Prepared by' line.
What is on the slides
The deck is written as slides, not as the PDF cut into pages.
- A cover with the report title and your 'Prepared by' line
- A summary slide: the key figures as tiles and a short written summary
- The top 3 findings, each with a recommendation
- One slide per chart: its main finding as the title, a box with what the chart shows in up to 4 points, and the next step
- The first table of each section, then every finding with its recommendation
- Details and method notes at the end, with more background in the speaker notes
Good to know before you upload
- The deck is built from your data. It does not copy the cells, formatting or existing charts of your worksheet onto slides.
- Charts on the slides are pictures, not PowerPoint chart objects. Text and tables are editable.
- Every deck uses CleanChart's own layout. Your own PowerPoint template, logo or brand colours are not supported.
- A file with fewer than 10 rows, more than 20,000 rows or too few findings still gets a chart, but no report and no deck.
- The slides are written in the language of your column headers: English, Spanish, German, French, Italian, Portuguese or Dutch. You can change it in the preview.
Only need one chart on one slide?
Then you don't need a deck. Copy the chart in Excel and paste it into PowerPoint, or download your chart here as an image and insert it. Microsoft Support: insert Excel data in PowerPoint
Frequently asked questions
Can I convert an Excel file to PowerPoint for free?
The chart from your file is free, with a small watermark, and so is the preview of page 1 of the report. The PowerPoint deck is part of the report, which comes with the Deadline Pass ($4.99, one payment for 24 hours) or Pro ($19 a month).
Does it copy my spreadsheet onto slides?
No. It analyses the data in the sheet and builds new slides: charts, findings and recommendations. Your cell formatting and the charts you made in Excel are not carried over.
Can I edit the slides afterwards?
Yes, the deck is a normal .pptx file. Titles, text and tables are editable. The charts are pictures, so they look the same on every computer.
Can I use my company's PowerPoint template?
Not inside CleanChart: every deck uses the same layout, without logos or brand colours. You set the title and a 'Prepared by' line.
Which Excel files work?
.xlsx and .xls files of up to 2 MB with one header row and one row per record. For a report and a deck the table needs 10 to 20,000 rows. In a workbook with several sheets you pick the sheet.
How many slides will I get?
That depends on the file: one slide per chart the report draws, plus the cover, the summary, the findings and the details.
Guides and related pages
CSV to PowerPoint, step by step
A worked example with a sales export
Export charts to PowerPoint and Google Slides
The right format and size for a single chart
Charts for presentations
What makes a chart readable on a slide
Spreadsheet to report
Charts, PDFs and slides: which one you need
More reports and decks from a file
Your file is all it takes
Upload it, get the chart free and see page 1 of your report before you decide.
Upload your Excel file to start