Survey report
Survey report from your Google Forms or Excel responses
Download the responses from Google Forms, Microsoft Forms or Typeform and upload the file. CleanChart reads the rating questions, works out the agreement per question and the Net Promoter Score, and writes up what stands out, with charts and a PowerPoint deck.
Upload your survey responses to start
- Free chart first
- No signup
- No stored copy of your rows
The report and the deck have a free preview and come with the Deadline Pass ($4.99) or Pro.
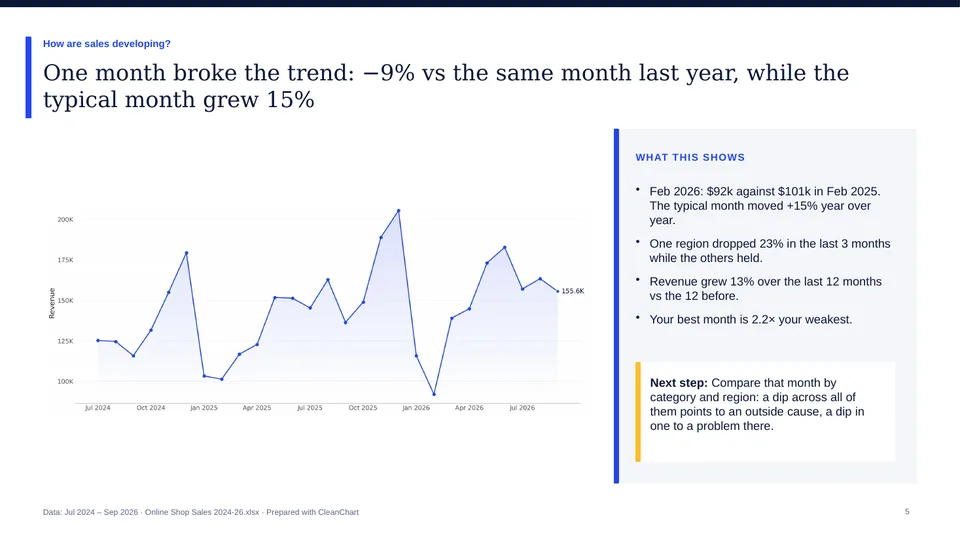
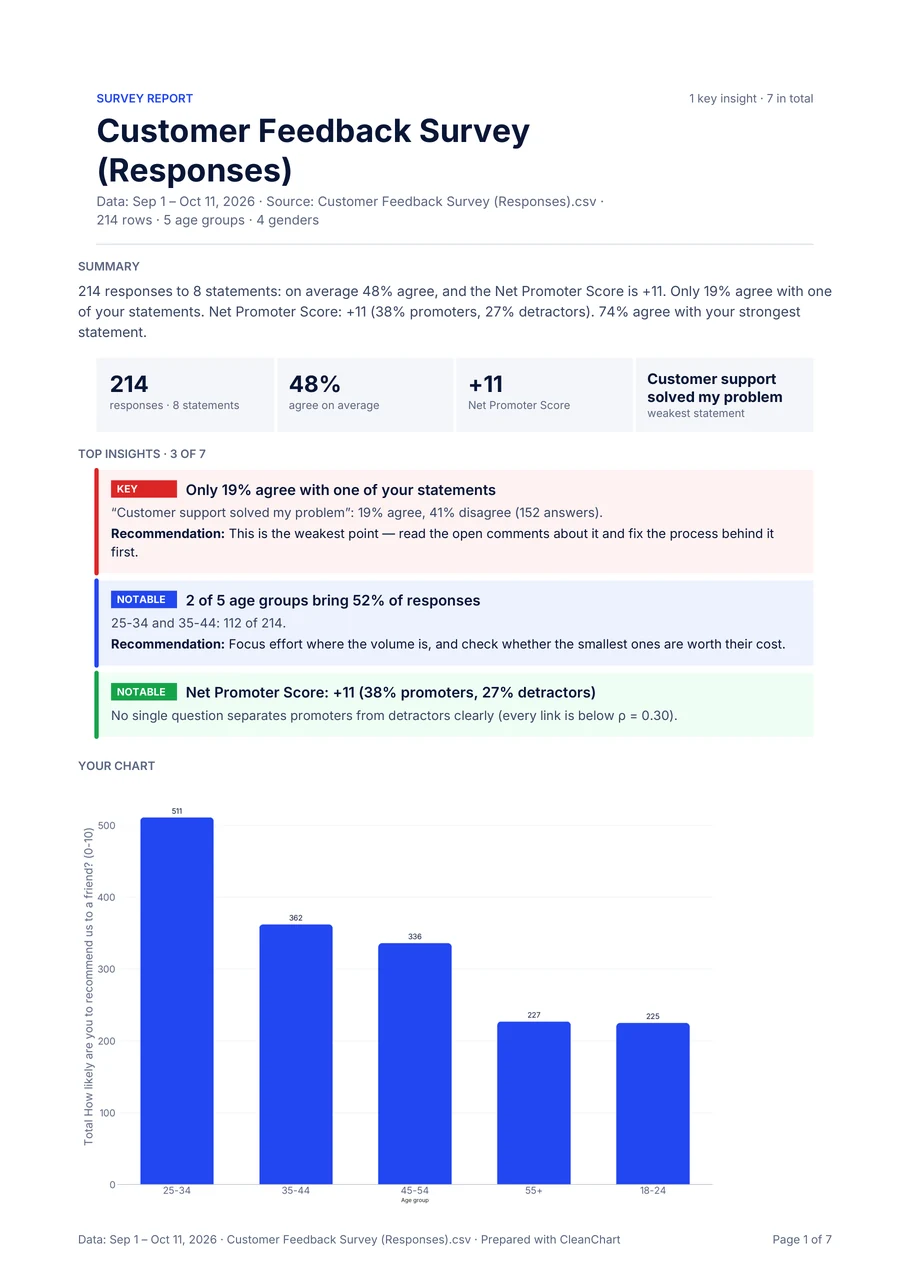
From one response file
Results per question
Agreement for every rating question, the strongest and the weakest item, and the questions that split your respondents.
Net Promoter Score
With a 0 to 10 'how likely are you to recommend' question: the score and its share of promoters and detractors.
Differences between groups
With a column such as age group, team or region, the report shows where one group answers clearly differently.
How to turn survey responses into a report
- 1
Download the responses
In Google Forms, open Responses, click the three dots and choose Download responses (.csv). Microsoft Forms and Typeform have their own Excel or CSV export.
- 2
Upload the file
One row per respondent and one column per question, up to 2 MB. Answers can be words, from Strongly disagree to Strongly agree, or numbers on a scale such as 1 to 5.
- 3
See page 1 free
A chart of the answers appears at once. With at least 10 responses and enough findings, a free preview shows page 1 of the report.
- 4
Download the report and the deck
The report as PDF and Word and the PowerPoint deck come with the Deadline Pass ($4.99, 24 hours) or Pro ($19 a month).
What a survey report holds
The findings depend on your questions. The sample report is built from a made-up customer survey.
- Agreement per question: The share who agree with each statement, from the strongest to the weakest.
- Split opinions: Questions where many agree and many disagree, which an average would hide.
- Net Promoter Score: Promoters, passives and detractors from a 0 to 10 question.
- Group gaps: Where one age group, team or region answers clearly differently.
- Skipped questions: Questions that many respondents left empty. Open the sample survey report (PDF)
Good to know before you upload
- The survey part needs at least three rating questions (a scale or answers such as agree and disagree), each answered at least 10 times.
- Open text answers are not summarised or quoted in the report.
- The file needs one header row with the questions. If your tool exports a second header row with the answer options, delete that row first.
- The report describes your respondents. It does not weight the sample or test whether a difference is statistically significant.
- It is written in the language of your column headers: English, Spanish, German, French, Italian, Portuguese or Dutch.
Only need a chart per question?
Google Forms already shows a summary chart for every question on its Responses tab, free. This page is for when you need a written report or slides made from those answers. Google Docs Editors Help: View and manage form responses
Frequently asked questions
How do I make a report from Google Forms responses?
Download the responses as a CSV (Responses, three dots, Download responses), upload the file here, check the free preview and generate the report. You get a PDF, a Word file and a PowerPoint deck.
Does it calculate the Net Promoter Score?
Yes, when the file has a 0 to 10 question such as 'How likely are you to recommend us?'. The report shows the score and the share of promoters and detractors.
Which answer formats work?
Agreement, satisfaction and likelihood scales in words, such as Strongly disagree to Strongly agree, and number scales such as 1 to 5 or 1 to 7, one column per question.
What does the survey report cost?
The chart and the preview of page 1 are free. The report and the deck come with the Deadline Pass ($4.99, one payment for 24 hours) or Pro ($19 a month).
Are the responses stored?
The file is processed in memory and we keep no copy of your rows. Before the written summary is drafted, names and IDs are replaced with placeholders.
Can the report be in another language?
It is written in the language of your column headers (English, Spanish, German, French, Italian, Portuguese or Dutch), and you can change it in the preview.
Guides and related pages
Survey results report
A worked example, section by section
Likert scale charts
How to chart agree and disagree answers
Charts for survey data
Which chart fits which question
CSV to stacked bar chart
When one chart of the answers is enough
More reports and decks from a file
Your file is all it takes
Upload it, get the chart free and see page 1 of your report before you decide.
Upload your survey responses to start