A survey results report needs six parts: a short summary with the response count, the question and the sample, the results per question, a breakdown by group, the findings ranked with a recommendation each, and a method note. Lead with the answer, end with the method. Download the sample survey file used below (CSV) to follow the worked example.
We make CleanChart, so weigh our ranking accordingly. The template works in Word, Google Docs or Excel. The example shows what a generated report returns for a real-shaped survey file, and what it cannot do.
What should a survey results report contain?
Six sections cover most survey reports, from a customer feedback round to a class questionnaire. Keep the first one short enough to read in a minute.
| Section | What goes in it | Typical length |
|---|---|---|
| 1. Summary | Number of responses, the headline score (for example percent agree or Net Promoter Score) and the weakest and strongest result | 3 to 5 sentences |
| 2. Question and sample | Why you asked, who was invited, who answered, the period and the response count | One short paragraph |
| 3. Results per question | For each statement: share who agree, neutral and disagree, plus how many skipped it | One table or one stacked bar chart |
| 4. Groups | Whether age, region or customer type answer differently, and who responded at all | One table per group column |
| 5. Findings and recommendations | Three to five findings, ranked, each with one action | One line each |
| 6. Method and limits | How agreement was defined, how skipped answers were handled, what open comments were not analysed | A short appendix |
Two choices decide whether the report can be trusted. First, define "agree" before you count: for a five-point Likert scale it is usually the two answers above the middle. Second, report skipped answers separately and never as zero. A statement that 29% of respondents skipped is a different finding from one they all answered.
Example: 214 responses to an 8-statement survey
The example is a sample file, not real customer data: 214 responses to a fictional online shop's feedback survey, collected between 1 September and 11 October 2026. Columns: a timestamp, age group, gender, eight statements rated from strongly disagree to strongly agree, a 0 to 10 recommendation question and a free-text comment. It is one of the sample files CleanChart uses to test its report engine; download it as CSV.
The starting chart is a bar chart of the share who agree per statement. Everything quoted below is the output of CleanChart's data report for this file, and it is the same report you can open as a PDF: survey report sample (PDF, 7 pages).
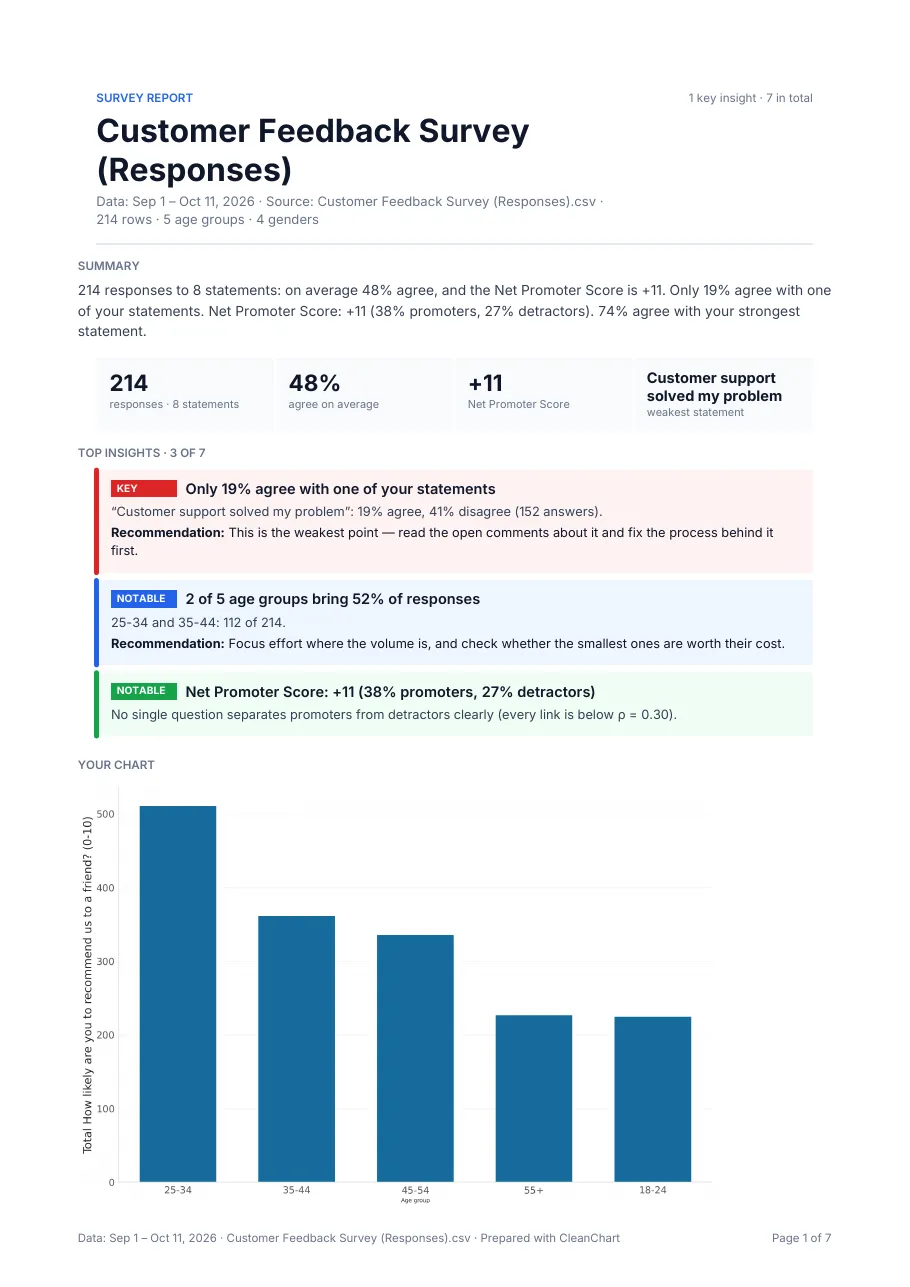
The numbers at the top
- 214 responses to 8 statements
- 48% agree on average
- +11 Net Promoter Score: 38% promoters (9 to 10) minus 27% detractors (0 to 6)
- Customer support solved my problem is the weakest statement
What did the analysis find?
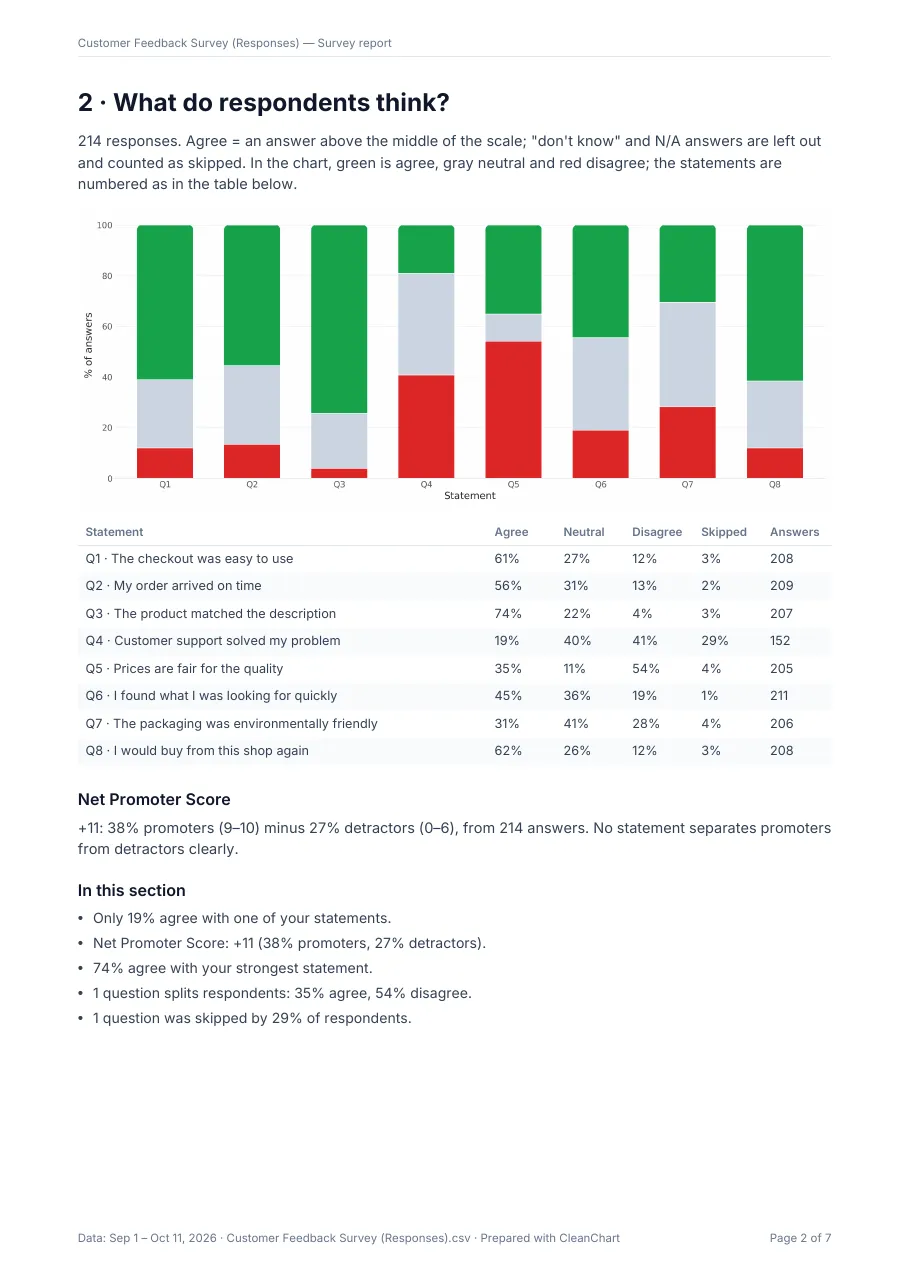
The report returned seven insights, ranked by importance. One is rated key, five notable and one informational. Here is the table of results per statement from page 2 of the report.
| Statement | Agree | Neutral | Disagree | Skipped | Answers |
|---|---|---|---|---|---|
| The checkout was easy to use | 61% | 27% | 12% | 3% | 208 |
| My order arrived on time | 56% | 31% | 13% | 2% | 209 |
| The product matched the description | 74% | 22% | 4% | 3% | 207 |
| Customer support solved my problem | 19% | 40% | 41% | 29% | 152 |
| Prices are fair for the quality | 35% | 11% | 54% | 4% | 205 |
| I found what I was looking for quickly | 45% | 36% | 19% | 1% | 211 |
| The packaging was environmentally friendly | 31% | 41% | 28% | 4% | 206 |
| I would buy from this shop again | 62% | 26% | 12% | 3% | 208 |
The insights, in the engine's own words with its recommendations:
| Finding | Detail | Recommendation |
|---|---|---|
| Only 19% agree with one of your statements | Customer support solved my problem: 19% agree, 41% disagree (152 answers) | The weakest point: read the open comments about it and fix the process behind it first |
| Net Promoter Score +11 | 38% promoters, 27% detractors; no single question separates them clearly (every link below rho = 0.30) | None stated; informational |
| 74% agree with the strongest statement | The product matched the description (207 answers) | Use it in your messaging |
| One question splits respondents | Prices are fair for the quality: 35% agree, 54% disagree, few neutral | Look at who answers which way; a split usually means two different groups |
| 2 of 5 age groups bring 52% of responses | 25-34 and 35-44: 112 of 214 | Focus where the volume is |
| 1 question was skipped by 29% | Customer support solved my problem | Add a "not applicable" option so skips are not mistaken for missing answers |
Source for all numbers: Customer Feedback Survey (Responses).csv, 214 rows, 1 Sep to 11 Oct 2026, sample data. The skipped-answer finding changes how to read the weakest statement: 19% agree among the 152 who answered, but 62 of 214 respondents did not answer at all, so the true picture may be a mix of unhappy customers and customers who never needed support.
The group section is worth noticing for what it does not say. The report compared every group column against every statement, 16 comparisons, with a chi-squared test on agree versus not agree, corrected for multiple comparisons with the Holm method. Its conclusion: no difference between groups holds after the correction, and the group tables only describe the groups, so differences can be chance. Average agreement by age group runs from 41% (55+, 31 respondents) to 51% (18-24, 28 respondents), but with groups this small the report does not call it a finding. A hand-written report should say the same instead of picking the biggest gap.
How do you turn the results into a report?
Fill the six sections in order from the tables above.
- Summary: "214 responses; 48% agree on average; Net Promoter Score +11. Support is the weak point: 19% of those who answered agree it solved their problem, and 29% skipped the question."
- Question and sample: "Where do customers see problems with checkout, delivery, support and price? Source: Customer Feedback Survey, 214 responses, 1 Sep to 11 Oct 2026." Add who was invited and the response rate if you know it; the file cannot tell you.
- Results per question: the table or a stacked bar chart of agree, neutral and disagree, sorted from strongest to weakest, with skipped shown as its own column.
- Groups: who answered (25-34 is 30% of responses) and how groups compare, with the caveat about small groups.
- Findings and recommendations: keep the first four findings above and one action each.
- Method and limits: agreement means an answer above the scale middle; skipped answers are not counted as disagree; open comments were counted, not read. In the sample file, 58 open answers exist and the report counts them without analysing them, so someone has to read them. For wider layout advice see how to build business reports with charts.
To pick the chart for each question type, see which chart suits Likert, ranking and NPS data. This page is about the report around the charts.
How do you get a first draft from your own survey file?
If your survey results are a CSV or Excel file, for example a Google Forms or Google Sheets response sheet downloaded as CSV or .xlsx, CleanChart can compute the findings and lay out the report.
- Upload the file to the CSV to bar chart converter or the Excel one and check the column mapping.
- Once the chart renders, open the report offer. The teaser and a blurred preview of page 1 are free.
- The full PDF comes with the Deadline Pass ($4.99 for 7 days) and with Pro.
A data report needs 10 to 20,000 rows and enough findings; files that do not meet that show no Report button. The report is an English PDF generated on demand. It is not saved to your dashboard, cannot be emailed on a schedule and is not a Word, PowerPoint or Excel file, so you cannot edit it inside the app. Free-text answers are counted, not read. There is no direct Google Sheets import and no paste: download the sheet as CSV or .xlsx first. More at how CleanChart reports work.
Write it by hand or generate it?
| Option | Pros | Cons |
|---|---|---|
| Word or Google Docs template | Full control of wording and house style; editable; free | You compute percentages, ranking and charts yourself; easy to count skips as disagree |
| Excel pivot tables or survey tool dashboards | Every figure traceable to a cell; survey tools often include basic charts | No ranking of what matters and no group test; the report is still written separately |
| CleanChart data report | Ranks findings, separates skipped answers, tests group differences with correction, one-page brief plus method appendix | Paid (comes with the Deadline Pass or Pro); English PDF only, not editable; needs 10 to 20,000 rows; does not read open comments and cannot explain causes |
Write by hand when the report needs your judgement on every line or a fixed house format. Generate a first draft when you have a clean response table and want to see what stands out before you write.
Frequently Asked Questions
What is a survey results report?
A document that states how many people answered, what they said per question, whether groups differ, and what to do about it. It usually has a summary, per-question results, findings with recommendations and a method note.
Is there a free survey results report template?
The six-section structure on this page is free to copy into any document, and so is the sample CSV. A generated PDF report from CleanChart is a paid feature with a free teaser and preview.
How do you calculate the percent who agree?
Count answers above the scale middle (agree and strongly agree on a five-point scale), divide by the answers given to that statement, and report skipped answers separately. The sample report does exactly this and leaves "don't know" answers out.
How many responses do you need?
There is no single number. Overall results can be read at a few dozen responses, but group comparisons need enough answers per group; the sample report only compares groups with at least 10 answers and still finds no gap that survives correction.
Which file formats can I analyse with CleanChart?
CSV, Excel (.xls and .xlsx), ODS, JSON, XML, YAML, TSV, TXT and Markdown. Google Sheets or Forms results work as a CSV or .xlsx download.
Related CleanChart Resources
Tools
- CSV to Bar Chart Converter – Upload survey results and open the report preview
- Excel to Bar Chart Converter – The same flow for Excel files
- Bar Chart Maker – Chart agreement per statement
Related Blog Posts
- Survey Chart: The Right Type for Every Question – Chart choice for Likert, NPS and multiple choice
- Data Analysis Report Template: Worked Example – The same idea for support ticket data
- Business Reports with Charts: Complete Guide – Layout for a wider audience
External Resources
- Wikipedia: Likert scale – How agreement scales work
- Wikipedia: Net promoter score – Promoters minus detractors