A data analysis report needs six parts: a one-paragraph summary, the question and the data, the three to five findings that matter, one chart per finding, a recommendation for each finding, and a method note. Put the answer first and the method last. Download the sample file used below (CSV) to follow the worked example.
We make CleanChart, so weigh our ranking accordingly. The structure below works in Word, Google Docs or Excel. The example shows where a generated report can save you the first draft, and where it cannot.
What should a data analysis report contain?
Six sections cover almost every data analysis report, from a class assignment to a quarterly review. Write them in this order, and keep the first one short enough to read in a minute.
| Section | What goes in it | Typical length |
|---|---|---|
| 1. Summary | The three or four numbers that matter and the single most important finding | 3 to 5 sentences |
| 2. Question and data | What you set out to answer, where the data comes from, the period and the row count | One short paragraph |
| 3. Findings | Ranked, each as: what you found, how big it is, why it matters | 3 to 5 items |
| 4. Charts and tables | One chart per finding, titled with the takeaway, with a source line | One per finding |
| 5. Recommendations | One action per finding, with an owner if you know it | One line each |
| 6. Method and limits | How the numbers were computed, what was cleaned or excluded, what the data cannot tell you | A short appendix |
This is the same shape as the exploratory data analysis workflow: look at the data, find what stands out, then say what to do about it. The part most templates leave out is the ranking in section 3. A report that lists twelve findings equally is a data dump; a report that ranks them tells the reader where to look first.
Example: 640 support tickets, Jul to Sep 2026
The example is a sample file, not real customer data: 640 support tickets from a fictional shop, created between July and September 2026, with these columns: Ticket ID, Created, Priority, Category, Status, Resolution time (h) and SLA (h). It is one of the sample files CleanChart uses to test its report engine, and you can download it as CSV.
The starting chart is a bar chart of median resolution time per category. We uploaded the file, picked Category and Resolution time (h) and let CleanChart's data report analyse it. Everything quoted below is the engine's own output for this file, run on 6 November 2026. The same file produces the sample report you can open as a PDF: operations report sample (PDF, 10 pages).
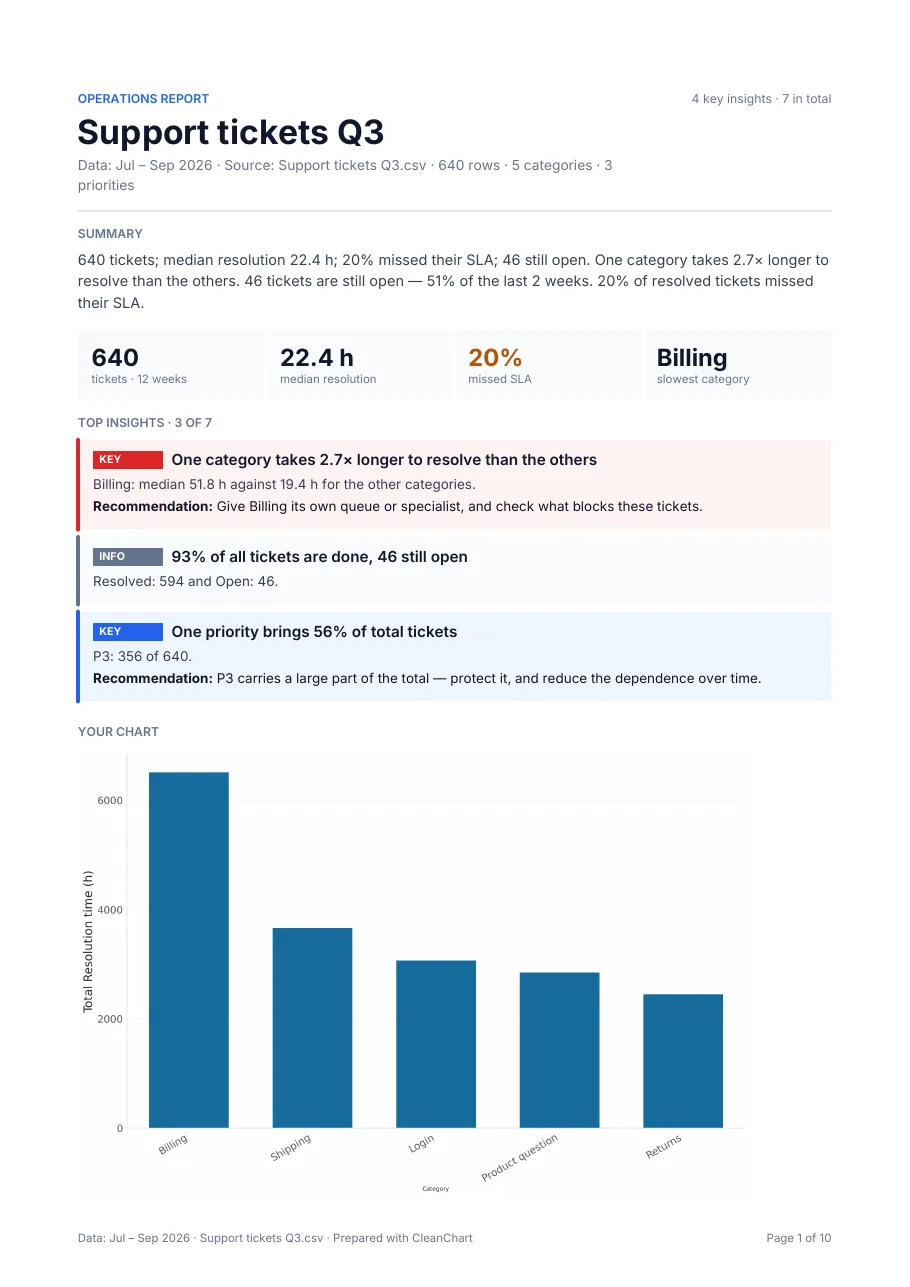
The numbers at the top
- 640 tickets over 12 weeks
- 22.4 h median resolution time
- 20% of resolved tickets missed their SLA (121 of 594)
- Billing is the slowest category
What did the analysis find?
The engine returned seven findings, ranked by severity. Four are high or medium severity. Here they are as it states them, each with its impact and recommendation.
| Finding | Detail | Recommendation |
|---|---|---|
| One category takes 2.7x longer to resolve than the others | Billing: median 51.8 h against 19.4 h for the other categories | Give Billing its own queue or specialist, and check what blocks these tickets |
| 46 tickets are still open, 51% of the last 2 weeks | 46 of the 90 tickets created in the last 14 days of the data are open | Clear the oldest open items first and check whether intake outgrew capacity |
| 20% of resolved tickets missed their SLA | 121 of 594 resolved tickets took longer than their SLA | Start with the categories that miss most often |
| One priority brings 56% of total tickets | P3: 356 of 640 | P3 carries a large part of the total, so protect it and reduce the dependence over time |
| 27% of the most urgent tickets missed their SLA | P1: 14 of 51 over their SLA | Urgent items need an escalation path that does not wait in the normal queue |
The other two findings are informational: 93% of tickets are done (594 resolved, 46 open), and the leading priority (P3, 356 tickets) is 1.5x the runner-up (P2, 230). Source for all numbers: Support tickets Q3.csv, 640 rows, Jul to Sep 2026, sample data.
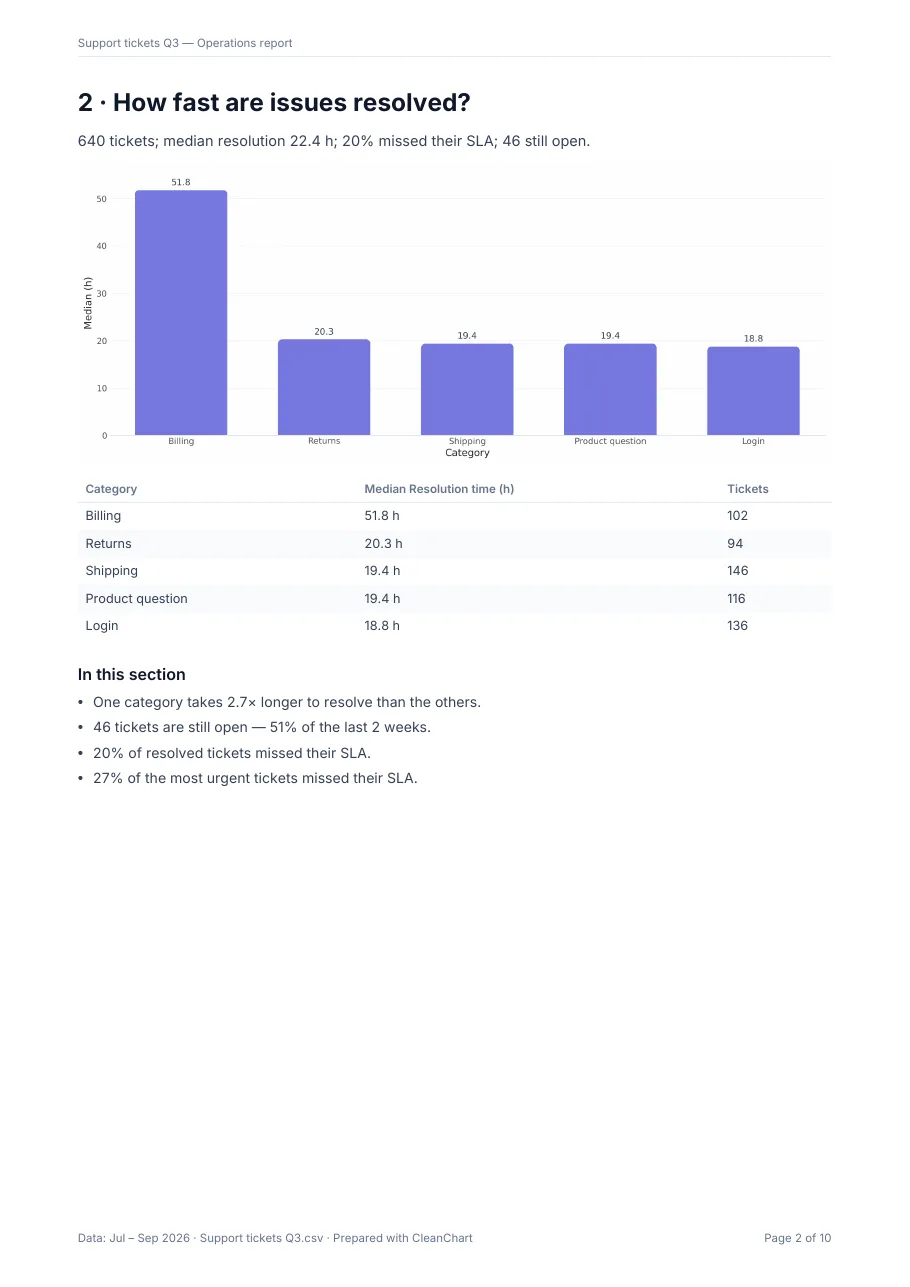
Notice what the ranking does. Billing is only 102 of the 640 tickets, yet it is the first finding because its resolution time is far out of line. The median is the right measure here because a few very slow tickets would distort an average; see Wikipedia: Median for the definition.
How do you turn findings into a report?
Take the findings table and fill the six sections of the template in order.
- Summary: "640 tickets, median resolution 22.4 h, 20% missed their SLA, 46 still open. Billing takes 2.7x longer than other categories."
- Question and data: "Where are support tickets slow, and is the backlog growing? Source: Support tickets Q3.csv, 640 rows, Jul to Sep 2026."
- Findings: keep the five above, in that order. Drop the informational ones unless the reader asks.
- Charts: the bar chart of median resolution time by category, titled "Billing tickets take 2.7x longer to resolve", with the source line under it.
- Recommendations: one line per finding, as in the table.
- Method and limits: say that resolution time is a median, that open tickets have no resolution time yet, and that this is a sample file. If the report goes to a wider audience, see how to build business reports with charts.
The method note matters more than it looks. The sample file cannot tell you why Billing is slow, only that it is. Say that in the report, so the recommendation reads as "check what blocks these tickets" and not as a diagnosis.
How do you get a first draft from your own file?
If your data is a CSV or Excel file, CleanChart can compute the findings and lay out the report for you.
- Upload the file to the CSV to bar chart converter or the Excel one and check the column mapping.
- Once the chart renders, open the report offer. The teaser (number of findings and key figures) and a blurred preview of page 1 are free.
- To get the full PDF, a data report costs $2.99 for one dataset; it is also included in the 24h pass and the monthly plan.
A data report needs 10 to 20,000 rows and at least four findings, one of them of medium or high severity. Files that do not meet that show no Report button. The report is an English PDF for download; it is not saved to your dashboard, and the written summary is produced from the computed findings, not from your raw rows. It is not a Word, PowerPoint or Excel file, so you cannot edit it inside the app. More on what each report contains is at how CleanChart reports work.
Write it by hand or generate it: which should you use?
| Option | Pros | Cons |
|---|---|---|
| Word or Google Docs template | Full control over wording and layout; editable; fits any house style | You do the analysis, ranking and charts yourself; easy to bury the main finding |
| Excel with pivot tables | No new tool; every number can be traced to a cell | Finding the patterns is manual; the report is still written separately |
| CleanChart data report | Computes and ranks findings from the file; one-page brief, charts and method appendix in one PDF | Paid ($2.99 per report); English PDF only and not editable; needs 10 to 20,000 rows and enough findings; cannot explain causes |
Write by hand when the report needs your judgement and context on every line, or must follow a house format. Generate a first draft when you have a clean table and want to see what stands out before you write.
Frequently Asked Questions
What is a data analysis report?
A document that states what a dataset shows, how big the effects are, and what to do about them. It usually has a summary, the data description, ranked findings with charts, recommendations and a method note.
Is there a free data analysis report template?
The six-section structure on this page is free to copy into any document. The sample CSV is free too. A generated PDF report from CleanChart is a paid feature, with a free teaser and preview.
How long should a data analysis report be?
As short as the findings allow. The sample report above is 10 pages, but page 1 carries the whole answer. Most readers should be able to stop after the first page.
What is the difference between findings and recommendations?
A finding states what the data shows, for example Billing tickets take 2.7x longer to resolve. A recommendation says what to do, for example give Billing its own queue. Keep them separate so the reader can disagree with one and accept the other.
Which file formats can I analyse with CleanChart?
CSV, Excel (.xls and .xlsx), ODS, JSON, XML, YAML, TSV, TXT and Markdown. Google Sheets works as a CSV or .xlsx download. There is no direct import and no paste.
Related CleanChart Resources
Tools
- CSV to Bar Chart Converter – Upload a file and open the report preview
- Excel to Bar Chart Converter – The same flow for Excel files
- Bar Chart Maker – Build the chart from any category data
Related Blog Posts
- Business Reports with Charts: Complete Guide – Layout and chart choice for a wider audience
- Excel Sales Report: Sample and How to Build It – The same idea for sales data
- Charts for Survey Data – Reporting Likert and NPS results
External Resources
- Wikipedia: Exploratory data analysis – The look, find, explain workflow behind most reports
- Wikipedia: Median – Why medians suit skewed times
- Wikipedia: Service-level agreement – What an SLA is