Excel to report
Excel report generator: from spreadsheet to a written report with charts
Upload the spreadsheet you would otherwise turn into a report by hand. CleanChart computes the key figures, draws the charts and ranks what it finds, each finding with its impact and a recommendation. You get a PDF, an editable Word file and a PowerPoint deck.
Upload your spreadsheet to start
- Free chart first
- No signup
- No stored copy of your rows
The report and the deck have a free preview and come with the Deadline Pass ($4.99) or Pro.
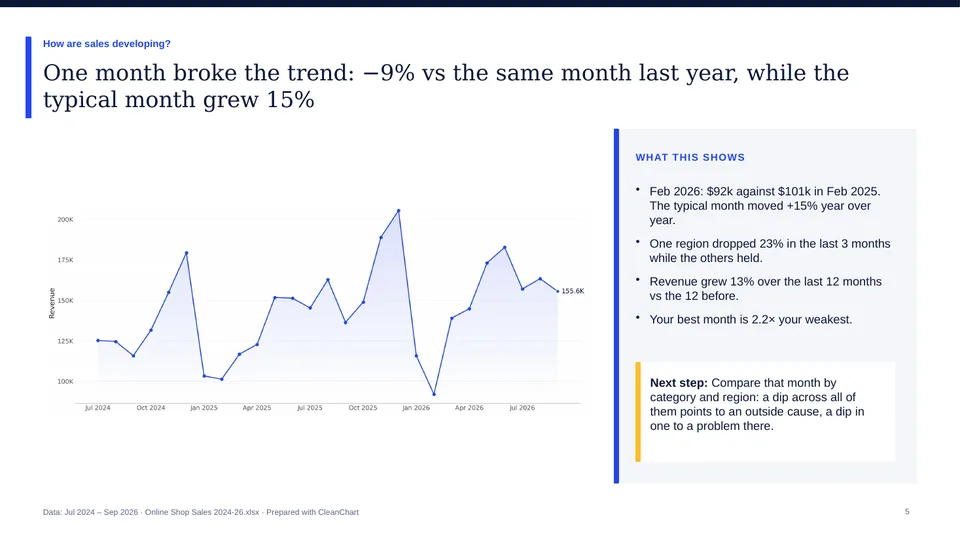
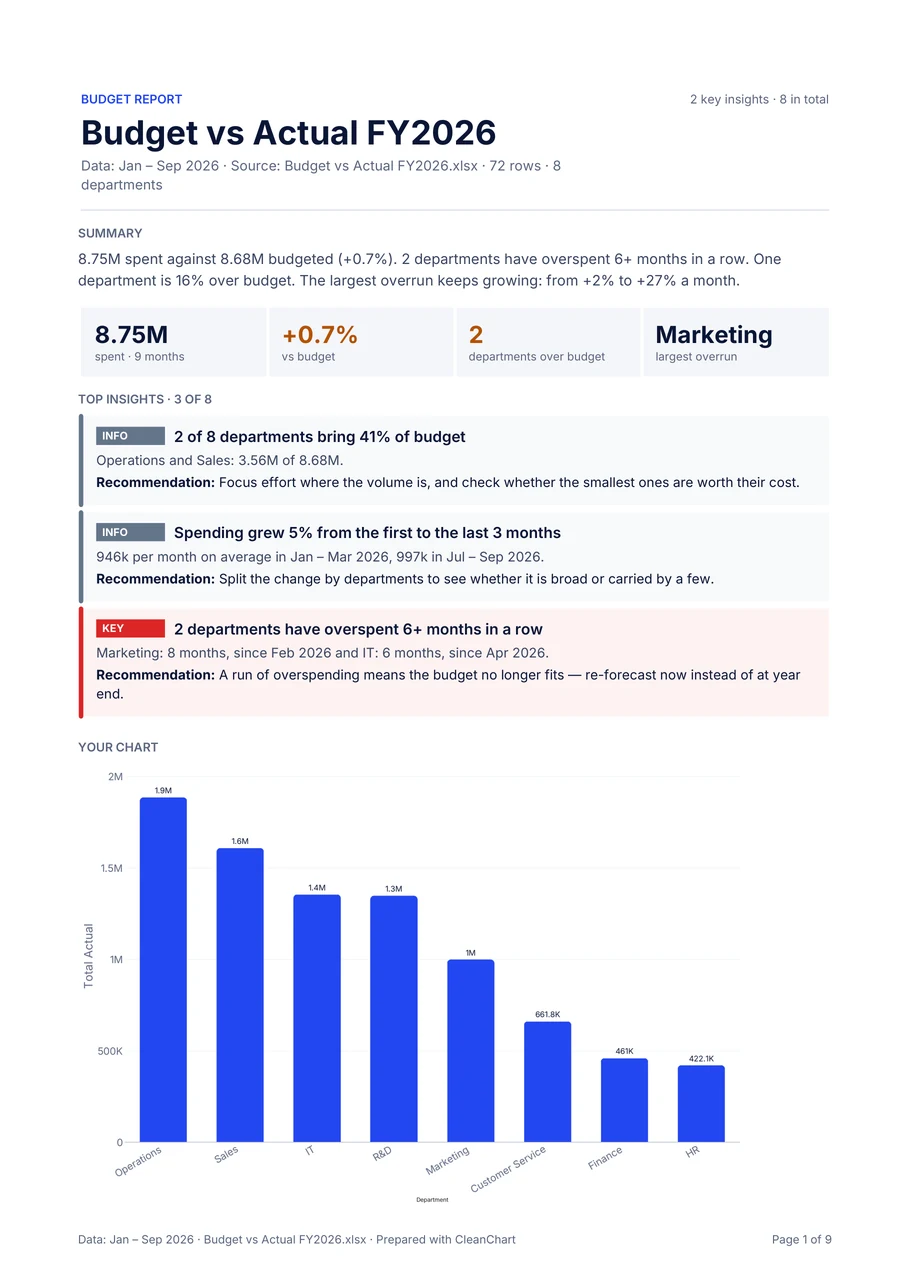
What the report contains
A one-page brief
Page 1 holds the key figures as tiles, the top 3 findings with a recommendation each and a written summary of 3 to 5 sentences.
Charts and tables per section
After the brief, each section has its charts and tables, and every finding is ranked: what was found, why it matters, what to do.
Three formats
A multi-page PDF to send, a Word file to edit and a PowerPoint deck to present.
How to generate a report from Excel
- 1
Upload the spreadsheet
An .xlsx, .xls, .ods or CSV file of up to 2 MB with one header row. You see a chart first, free.
- 2
See which report fits
From the columns CleanChart suggests a report type, such as a sales, budget, marketing, survey or people report. You can pick another type the file fits.
- 3
Choose what it answers
Pick 2 to 10 questions from a list the file can answer and mark the most important one; it comes first. Set the title, a 'Prepared by' line and who reads the summary: a manager, a client or a thesis reader.
- 4
Generate and download
Generating needs the Deadline Pass ($4.99, 24 hours) or Pro. The written summary is produced from the computed findings, never from your raw rows.
Report types and what each one adds
The type is chosen from your columns. Each sample is a real report built from sample data.
- Sales report: Revenue over time and by category, and gross margin when there is a cost column. Sample sales report (PDF)
- Budget report: Actual against budget per category, and where spending runs over. Sample budget report (PDF)
- Marketing report: Conversion rate per channel or campaign, and cost per conversion when there is a spend column. Sample marketing report (PDF)
- Survey report: Likert scales and NPS, summarised per question. Sample survey report (PDF)
- People report: Headcount and median pay per department, and median tenure from a hire date. Sample people report (PDF)
- Research data report: Distributions, differences between groups and relationships between measurements. Sample research report (PDF)
Good to know before you upload
- Every number is computed from your file. The report makes no forecast, pulls in no outside data and writes no free-form answers.
- It needs 10 to 20,000 rows and enough findings worth reporting. A flat or tiny table gets a chart only.
- Reports are downloads. They are not saved in an account and cannot be emailed on a timetable.
- There is no Excel output: the report comes as PDF, Word and PowerPoint.
- The layout is fixed, without a custom template, logo or brand colours.
- A pass covers up to 5 report generations per file and 20 per day.
Need a dashboard that updates by itself?
A report is a snapshot of one file. For numbers that have to stay current without a new upload, a BI tool such as Google's Data Studio is the better fit. Google Data Studio
Frequently asked questions
How do I turn an Excel sheet into a report?
Upload the file, check the chart and the free preview of page 1, choose the questions the report should answer and generate it. You download a PDF, a Word file and a PowerPoint deck.
Is the report written by AI?
The figures, charts and findings are computed by a fixed report engine. Only the short written summary is drafted by an AI model (Claude), from the computed findings and never from your raw rows, and its numbers are checked against them.
Can I edit the report?
Yes. The Word file and the PowerPoint deck are editable; the PDF is the fixed version to send.
What does the report cost?
The chart and the preview of page 1 are free. The report is included in the Deadline Pass ($4.99, one payment for 24 hours) and in Pro ($19 a month).
Can I tell it what I want to find out?
Yes. Besides the list of questions you can type what you want to know, in up to 500 characters. The report then adds one page for it, computed from your own columns. What the file cannot answer is listed on the last page.
Which languages are supported?
Data reports are written in the language of your column headers: English, Spanish, German, French, Italian, Portuguese or Dutch. Project reports are in English.
Guides and related pages
Spreadsheet to report
Charts, PDFs and slides: which one you need
Data analysis report
The structure of a good report, with an example
Survey results report
A worked example from survey data
Business reports with charts
Which chart belongs in which report
More reports and decks from a file
Your file is all it takes
Upload it, get the chart free and see page 1 of your report before you decide.
Upload your spreadsheet to start