Project status report
Project status report from your plan in Excel or CSV
Upload the task list you already keep: an Excel sheet or the CSV export of your project tool. You get the Gantt chart free, then a status report that says where the project stands, what is late and what to do about it, with a PowerPoint deck for the meeting.
Upload your project plan to start
- Free chart first
- No signup
- No stored copy of your rows
The report and the deck have a free preview and come with the Deadline Pass ($4.99) or Pro.
From one project file
Where the project stands
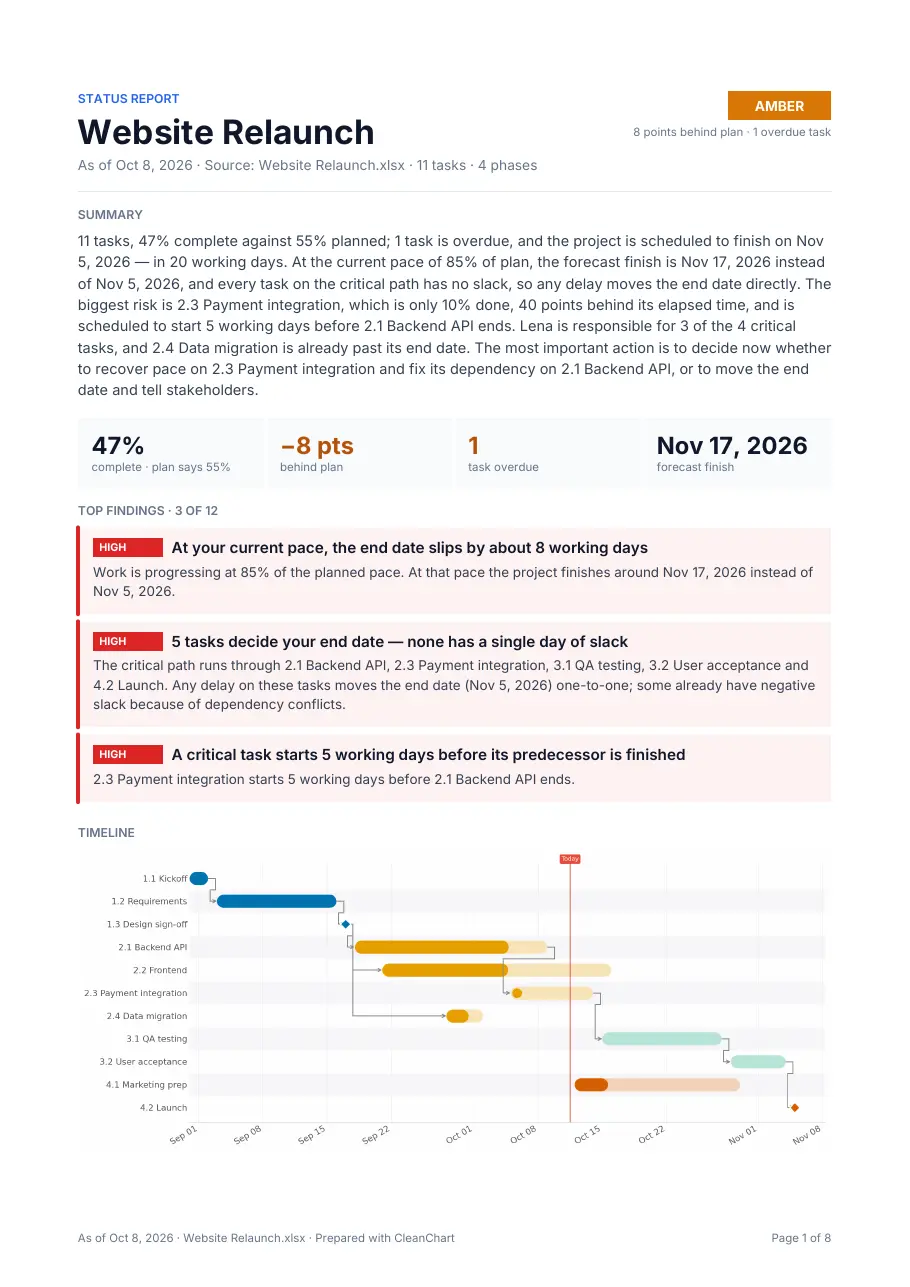
A one-page brief with the top 3 findings and a recommendation each. With a progress or status column it adds progress against plan, overdue tasks and a forecast finish.
Several charts, not only the Gantt
The timeline and the weekly workload, plus the critical path when the file has dependencies and planned against actual progress when it has a progress column.
A deck for the status meeting
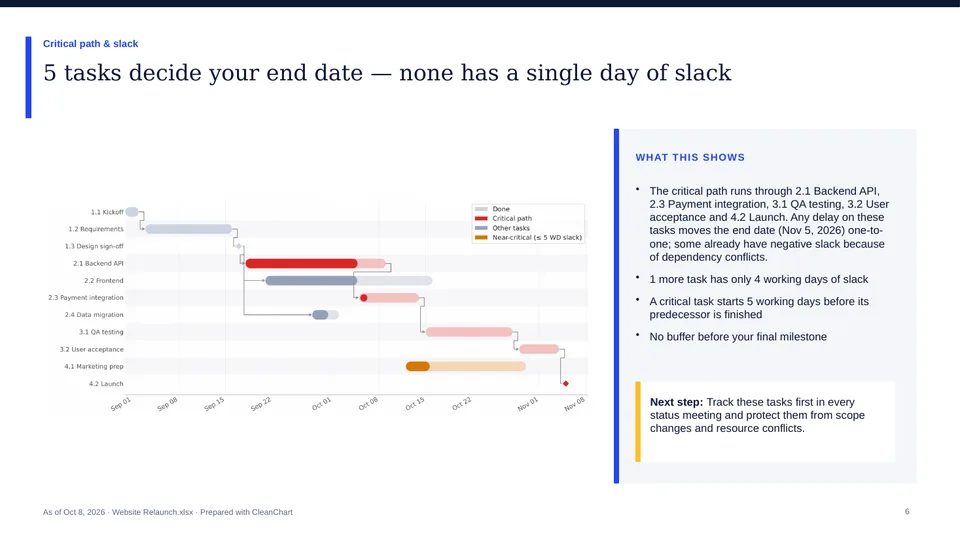
The same findings as PowerPoint slides: a summary, one slide per chart with its finding as the title, and every recommendation.
How to create a project status report
- 1
Upload the plan
An Excel or CSV file with one row per task, a start date and an end date. Exports from Microsoft Project, Jira, Smartsheet and similar tools work once they are saved as CSV or Excel.
- 2
Get the Gantt chart
The task, date, group and progress columns are recognised and the Gantt chart is drawn. It is free with a small watermark.
- 3
Preview the status report
With 5 or more dated tasks, the free preview shows page 1 of the report for your project.
- 4
Download the report and the deck
Both come with the Deadline Pass ($4.99, one payment, 24 hours) or Pro: a PDF, a Word file and a PowerPoint deck.
What the report reads from your columns
The more columns the plan has, the more the report can say.
- Task names and dates: A review of the plan and the timeline.
- Dependencies: The critical path and the slack of each task.
- A progress or status column: Progress against plan, variance, overdue tasks and the forecast finish.
- An owner column: The workload by person, with its peaks and risk hotspots.
Good to know before you upload
- Tasks need calendar dates. A plan in relative terms, such as Week 1 or Sprint 3, gets no report.
- A report needs at least 5 tasks and at most 2,000 rows.
- Project reports are written in English.
- The report reads the file you upload. It has no connection to your project tool, so upload the new export before the next meeting.
- Charts in the deck are pictures; text and tables are editable. There is no custom template or branding.
Looking for a blank template to fill in?
This page writes the report from your plan instead of handing you an empty form. If you would rather build the sheet by hand, our guide shows the layout. Project status report in Excel: layout and example
Frequently asked questions
Which columns does my project file need?
A task name, a start date and an end date. A group or phase column, a progress or status column, dependencies and an owner are optional; each one adds a part to the report.
Is this a template I fill in?
No. You upload the plan and the report is written from it. There is nothing to fill in by hand.
Can I use an export from Microsoft Project or Jira?
Yes. Export the tasks to Excel or CSV and upload that file. The .mpp file itself cannot be uploaded.
What does the status report cost?
The Gantt chart is free with a small watermark, and so is the preview of page 1. The report and the deck come with the Deadline Pass ($4.99, one payment for 24 hours) or Pro ($19 a month).
Does the report tell me what to do?
Each finding comes with its impact and a recommendation, for example which late task to look at first. It is computed from the dates and columns in the file; it knows nothing about the project beyond that.
How often can I generate a report?
With a pass, up to 5 times per file and 20 times a day.
Guides and related pages
Gantt chart report
An example and how to make one
Excel to Gantt chart
When the chart alone is enough
Microsoft Project to Gantt chart
How to export the plan first
Gantt chart maker
Columns, examples and a starter file
More reports and decks from a file
Your file is all it takes
Upload it, get the chart free and see page 1 of your report before you decide.
Upload your project plan to start