Budget vs actual report
Budget vs actual report from your Excel sheet
Put the budget and the actual figures side by side in one table and upload it. CleanChart works out the variance for every department or category, flags the overruns and writes up what needs a decision, with charts and a PowerPoint deck for the review.
Upload your budget sheet to start
- Free chart first
- No signup
- No stored copy of your rows
The report and the deck have a free preview and come with the Deadline Pass ($4.99) or Pro.
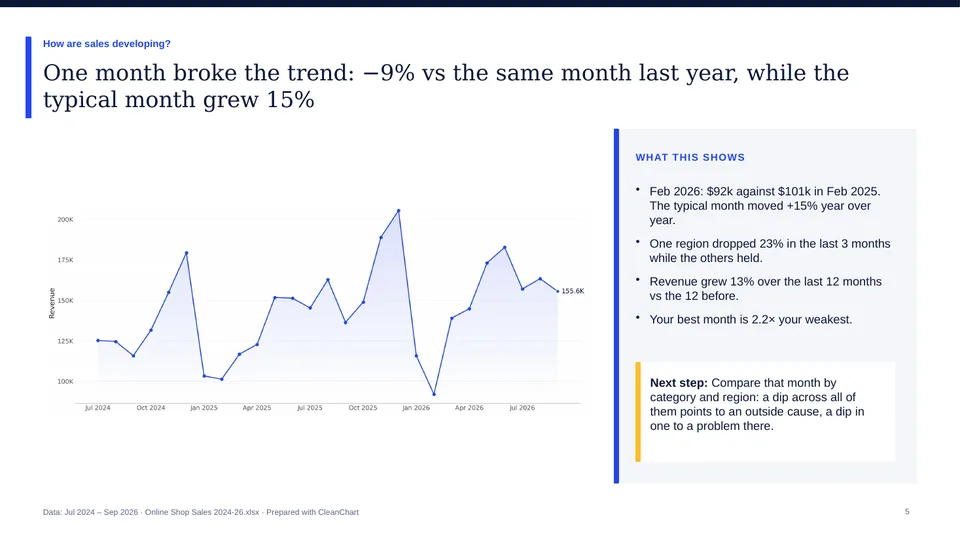
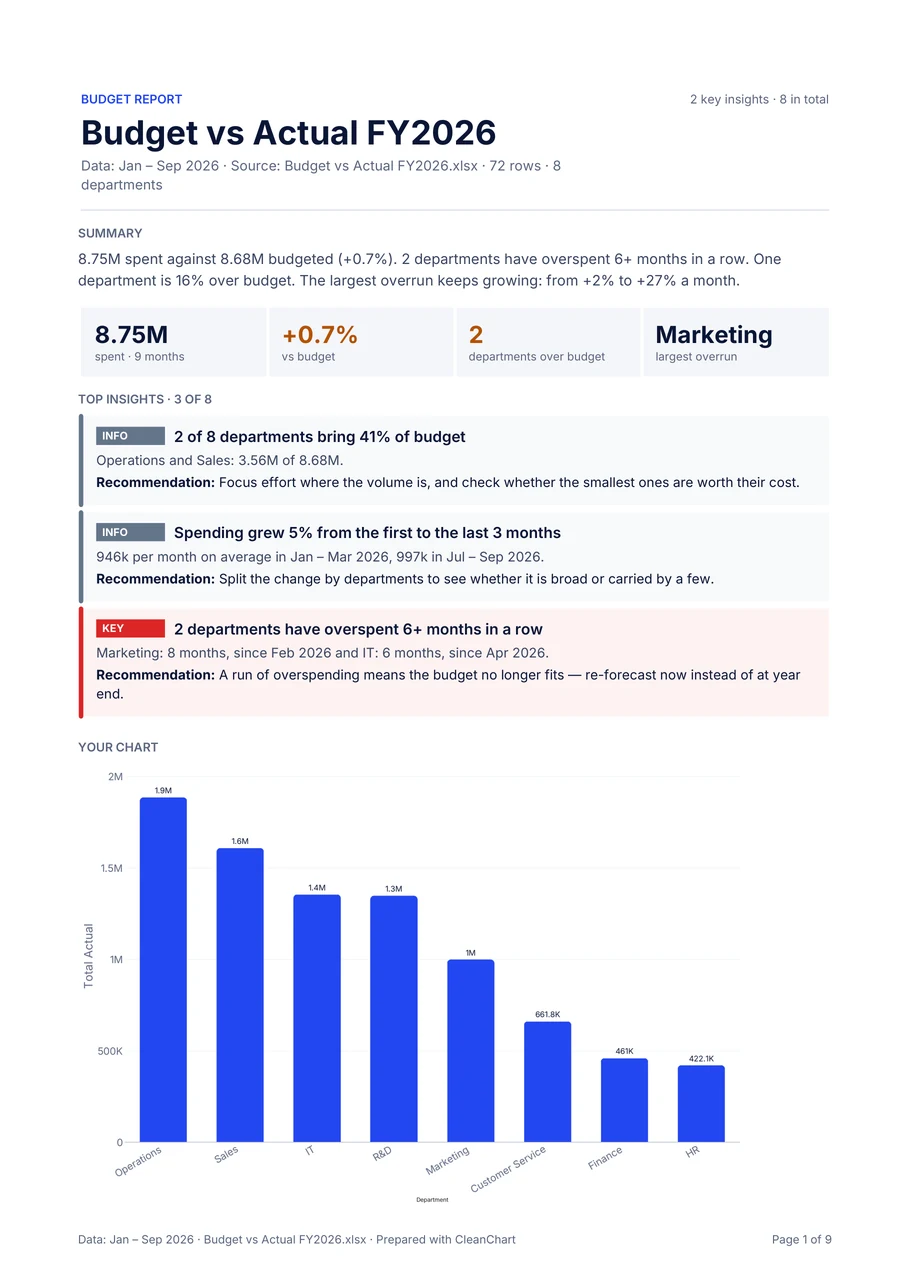
From one budget sheet
Variance per category
Actual against budget for every department, cost centre or category, and the total at the top of page 1.
Overruns flagged
Categories over budget, months in a row of overspending and an overrun that keeps growing.
Ready for the review
A one-page brief with the key figures and the top findings, then the details, as PDF, Word and a PowerPoint deck.
How to make a budget vs actual report
- 1
Lay out the table
One row per category and month, or per category, with a budget column and an actual column. The budget column can also be called plan or target.
- 2
Upload it
An Excel, ODS or CSV file of up to 2 MB with one header row. Exports from accounting software work once they are in that shape.
- 3
See page 1 free
With 10 or more rows and enough findings, the free preview shows page 1 of your budget report.
- 4
Download the report and the deck
Both come with the Deadline Pass ($4.99, 24 hours) or Pro ($19 a month).
What the budget report shows
The sample report is built from a made-up budget of four departments over a year.
- Total against budget: The overall variance, at the top of page 1.
- Variance per category: Which departments or categories are over and which are under budget.
- Overspending runs: With a month column: categories that went over several months in a row.
- Growing overruns: An overrun that gets bigger month by month. Open the sample budget report (PDF)
Good to know before you upload
- Budget and actual have to be in the same table. Two separate files can't be combined.
- The report describes the variance in your file; it makes no forecast for the rest of the year.
- There is no connection to QuickBooks, Xero or other accounting software: export the figures as Excel or CSV first.
- It needs 10 to 20,000 rows and enough findings; a short table gets a chart.
- Charts in the deck are pictures; text and tables stay editable. There is no custom template or logo.
Only need one chart of budget against actual?
Then a grouped bar chart of the two columns is enough, and it is free with a small watermark. Excel to bar chart
Frequently asked questions
How do I make a budget vs actual report from Excel?
Keep budget and actual in two columns of one table, upload the file here and check the free preview. The report shows the variance per category and the overruns, as PDF, Word and PowerPoint.
What does the table need?
A category column (department, cost centre or account), a budget, plan or target column and an actual column. A month column adds the trend and the overspending runs.
Does it work with exports from accounting software?
Yes, as long as the export is an Excel or CSV table with one header row. There is no direct connection to the software.
What does the budget report cost?
The chart and the preview of page 1 are free. The report and the deck come with the Deadline Pass ($4.99, one payment for 24 hours) or Pro ($19 a month).
Can I set who the report is for?
Yes. Set the title and a 'Prepared by' line, and choose whether the summary is written for a manager or a client.
Which languages are supported?
The report is written in the language of your column headers: English, Spanish, German, French, Italian, Portuguese or Dutch. You can change it in the preview.
Guides and related pages
Best chart for budget vs actual
Which chart makes the variance obvious
Financial data visualization
Charts for money, margins and budgets
Excel to waterfall chart
From budget to actual in one picture
Spreadsheet to report
Charts, PDFs and slides: which one you need
More reports and decks from a file
Your file is all it takes
Upload it, get the chart free and see page 1 of your report before you decide.
Upload your budget sheet to start