Marketing report
Marketing report from your GA4 or ads export
Export the channel or campaign numbers you look at every month and upload the file. CleanChart works out conversion rates and cost per conversion, spots the channel that slipped and writes it up with charts and a PowerPoint deck for your team or your client.
Upload your marketing export to start
- Free chart first
- No signup
- No stored copy of your rows
The report and the deck have a free preview and come with the Deadline Pass ($4.99) or Pro.
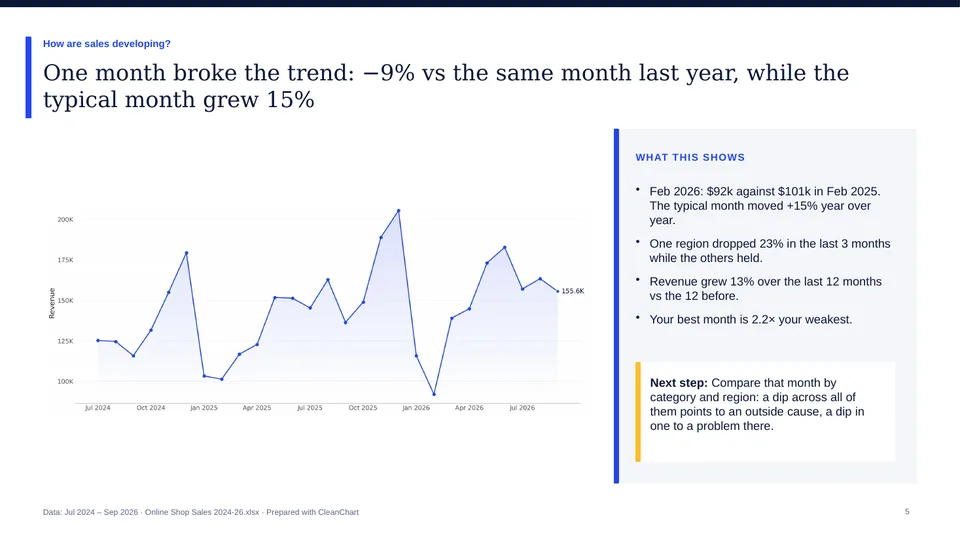
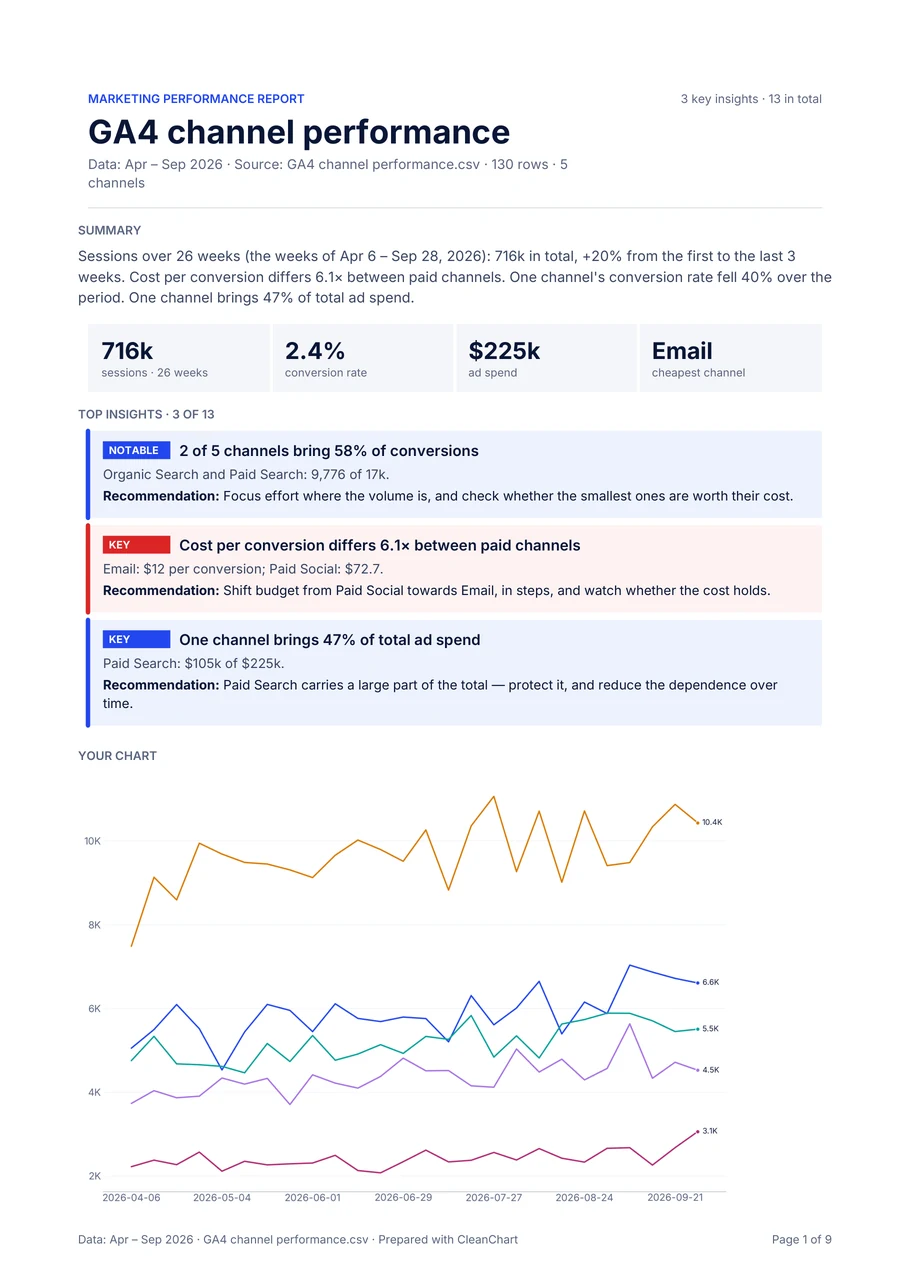
From one export
Conversion rate per channel
From a sessions or clicks column and a conversions column, per channel or campaign, with a finding when it falls.
Cost per conversion
With a spend column: what a conversion costs in each paid channel, and the gap between the cheapest and the most expensive one.
A deck for the meeting
One slide per chart with its finding as the title, the summary and the recommendations, plus the report as PDF and Word.
How to turn a marketing export into a report
- 1
Export the numbers
From GA4, Google Ads, Meta Ads or your email tool, download a table with one row per channel or campaign, and per week or month if you want the trend, as CSV or Excel.
- 2
Upload it
Up to 2 MB with one header row. Columns named like Sessions, Clicks, Conversions or Spend are picked up for the marketing part of the report.
- 3
See page 1 free
With 10 or more rows and enough findings, the free preview shows page 1 of your report.
- 4
Download the report and the deck
Both come with the Deadline Pass ($4.99, 24 hours) or with Pro ($19 a month), which suits a report you send every month.
What a marketing report holds
Built from your columns. The sample report uses made-up weekly GA4 channel data.
- Traffic and conversions by channel: Which channels bring the volume and which ones convert.
- Conversion rate: Per channel or campaign, with a finding when it falls.
- Cost per conversion: Per paid channel, when the file has a spend column.
- Trend over time: With a date column: the weekly or monthly development and the periods that broke the pattern. Open the sample marketing report (PDF)
Good to know before you upload
- There is no connection to GA4, Google Ads or any other tool. The report reads the file you export and upload.
- Nothing is scheduled: for next month's report, export and upload the new file.
- The report describes the numbers in the file. It does not attribute conversions between channels or forecast results.
- It needs 10 to 20,000 rows and enough findings; a file with only a handful of rows gets a chart.
- The layout is CleanChart's own, without your agency's logo or brand colours.
Need a dashboard your client can open any time?
A report is a snapshot of one export. For numbers that update themselves, Google's Data Studio connects to GA4 directly. Google Data Studio
Frequently asked questions
How do I turn a GA4 export into a report?
Download the report table from GA4 as a CSV, upload it here, check the free preview and generate the report. You get a PDF, a Word file and a PowerPoint deck.
Which columns does it need?
A channel or campaign column plus numbers such as sessions or clicks and conversions. A spend column adds cost per conversion, and a date column adds the trend.
Can I send the report to a client?
Yes. Set the title and a 'Prepared by' line, and choose the client as the reader of the summary. The layout is CleanChart's own.
What does the marketing report cost?
The chart and the preview of page 1 are free. The report and the deck come with the Deadline Pass ($4.99, one payment for 24 hours) or Pro ($19 a month).
Does it connect to Google Ads or GA4?
No. It reads an exported file; there is no account connection and nothing updates on its own.
Is the report written by AI?
The numbers, charts and findings are computed from your file. Only the short summary is drafted by an AI model (Claude), from those findings and never from your raw rows.
Guides and related pages
Marketing data visualization
Which chart shows which campaign number
How to create a funnel chart
From visits to conversions, step by step
CSV to line chart
When one trend chart is enough
Spreadsheet to report
Charts, PDFs and slides: which one you need
More reports and decks from a file
Your file is all it takes
Upload it, get the chart free and see page 1 of your report before you decide.
Upload your marketing export to start