CSV to PowerPoint
CSV to PowerPoint: slides with charts and findings, not a table of rows
PowerPoint has no way to open a CSV export. Upload it here instead: CleanChart detects the delimiter, reads the dates and numbers, charts the data and builds an editable deck that says what the numbers mean. Your first chart is free.
Upload your CSV export to start
- Free chart first
- No signup
- No stored copy of your rows
The report and the deck have a free preview and come with the Deadline Pass ($4.99) or Pro.
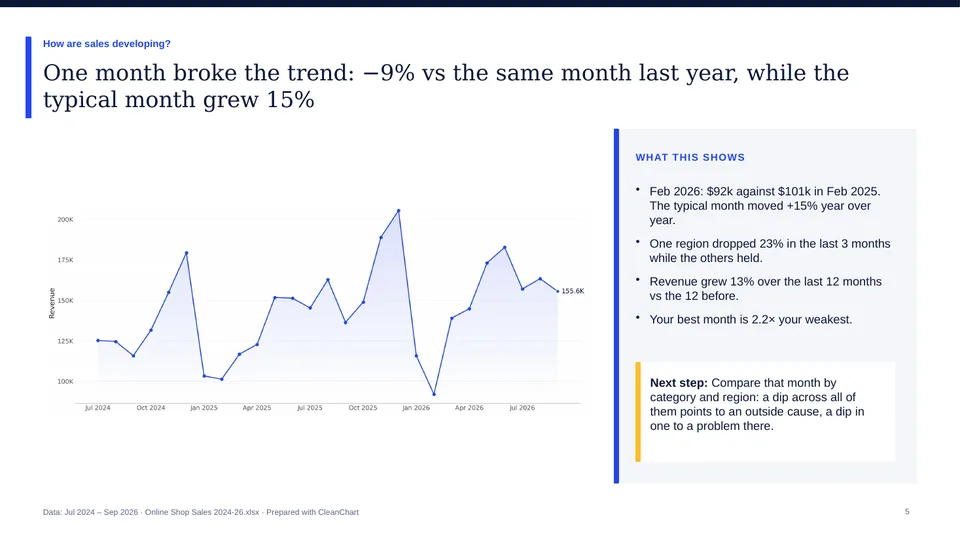
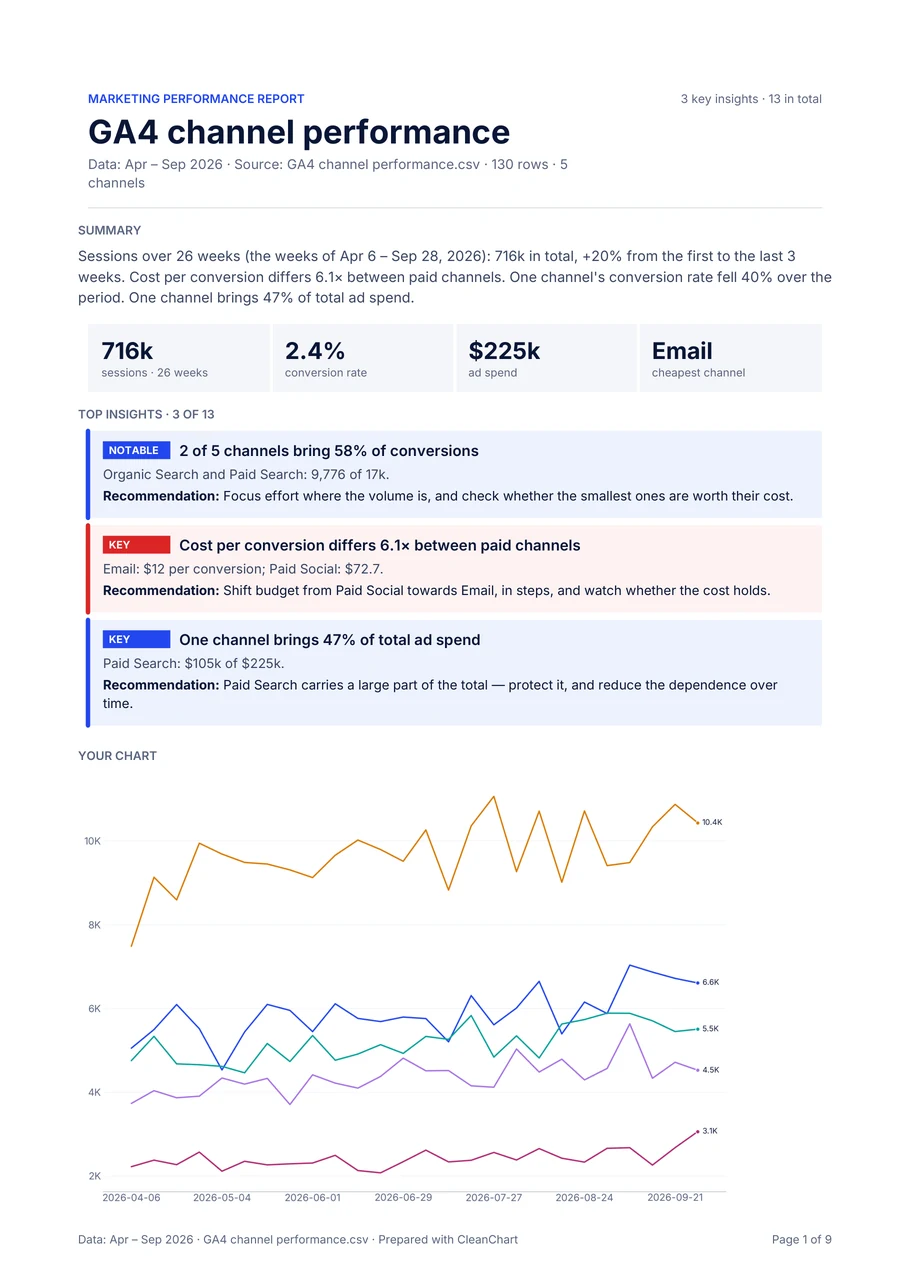
What comes out of the export
Slides that explain the export
One slide per chart, with the main finding as its title and a short box beside it: what the chart shows and what to do next.
Key figures up front
The deck opens with a summary slide that shows the totals and rates that matter in your file as tiles, followed by the top 3 findings.
PDF and Word included
The report behind the deck also comes as a multi-page PDF and an editable Word file, for the people who would rather read than watch.
How to get from a CSV to PowerPoint
- 1
Upload the CSV
Any CSV, TSV or TXT export of up to 2 MB works: from a shop, a CRM, an analytics tool or a database query. It needs one header row.
- 2
Let the cleaning run
Duplicate rows, missing values, mixed date formats and numbers stored as text are fixed automatically. A note next to the chart lists what was changed.
- 3
Look at the chart and the preview
You get a chart at once. If the export has 10 to 20,000 rows and enough findings, a free preview shows page 1 of the report built from it.
- 4
Get the deck
The PowerPoint file comes with the report in the Deadline Pass ($4.99 for 24 hours, one payment) or Pro. It downloads together with the PDF and the Word file.
What the report looks for in an export
Which slides you get depends on the columns in the file.
- A date column: the trend over time and seasonal patterns
- A category column: which groups carry the total, and how concentrated it is
- Several number columns: how they relate to each other, and which groups differ
- Sales with a cost column: gross margin overall and per category
- Traffic and conversions per channel: the conversion rate, and the cost per conversion when there is a spend column
- Budget and actual columns: the variance per category and where spending runs over
Good to know before you upload
- A CSV with only a handful of rows, or with nothing to compare, gets a chart but no deck. A report needs 10 to 20,000 rows and enough findings.
- The report reads one file. It does not join several CSV files or look anything up elsewhere.
- Charts in the deck are pictures; text and tables are editable. The layout is CleanChart's own, without a custom template or branding.
- Is the export larger than 2 MB? Filter or aggregate it first.
- Working in Google Sheets? Download the sheet as CSV and upload that file.
Just want the rows on a slide?
Then open the CSV in Excel and paste the table into PowerPoint. That gives you the raw rows without charts or findings, which is fine for a short list. Microsoft Support: import or export text (.txt or .csv) files
Frequently asked questions
Why can't I open my CSV in PowerPoint?
PowerPoint opens presentations, not data files. A CSV has to go through a spreadsheet or through a tool that turns the data into slides. CleanChart does the second: it charts the data and writes the slides.
Does my CSV need a special format?
One header row and one row per record. Comma, semicolon and tab separated files are read; the delimiter is detected from the file.
What does the PowerPoint deck cost?
The chart and the preview of page 1 of the report are free. The deck is part of the report, included in the Deadline Pass ($4.99, one payment, ends after 24 hours) and in Pro ($19 a month).
My export has German or Spanish headers. What language are the slides in?
In the language detected from the column headers: English, Spanish, German, French, Italian, Portuguese or Dutch. You can change it in the preview before you generate the report.
Is my data stored?
The file is processed in memory and we keep no copy of your rows. The report and the deck are downloads; they are not saved to an account.
Can I upload a TSV or a .txt export?
Yes. TSV and TXT files upload the same way as CSV.
Your file is all it takes
Upload it, get the chart free and see page 1 of your report before you decide.
Upload your CSV export to start