Gantt chart for PowerPoint
Gantt chart for PowerPoint, built from your project plan
Drawing a Gantt chart in PowerPoint means one shape per task and moving them all again when a date changes. Upload the plan you already keep in Excel or CSV instead: you get the Gantt chart as an image for your slide, free, and if the meeting needs more, a whole deck about the project.
Upload your project plan to start
- Free chart first
- No signup
- No stored copy of your rows
The report and the deck have a free preview and come with the Deadline Pass ($4.99) or Pro.
From one plan
A Gantt chart for your slide
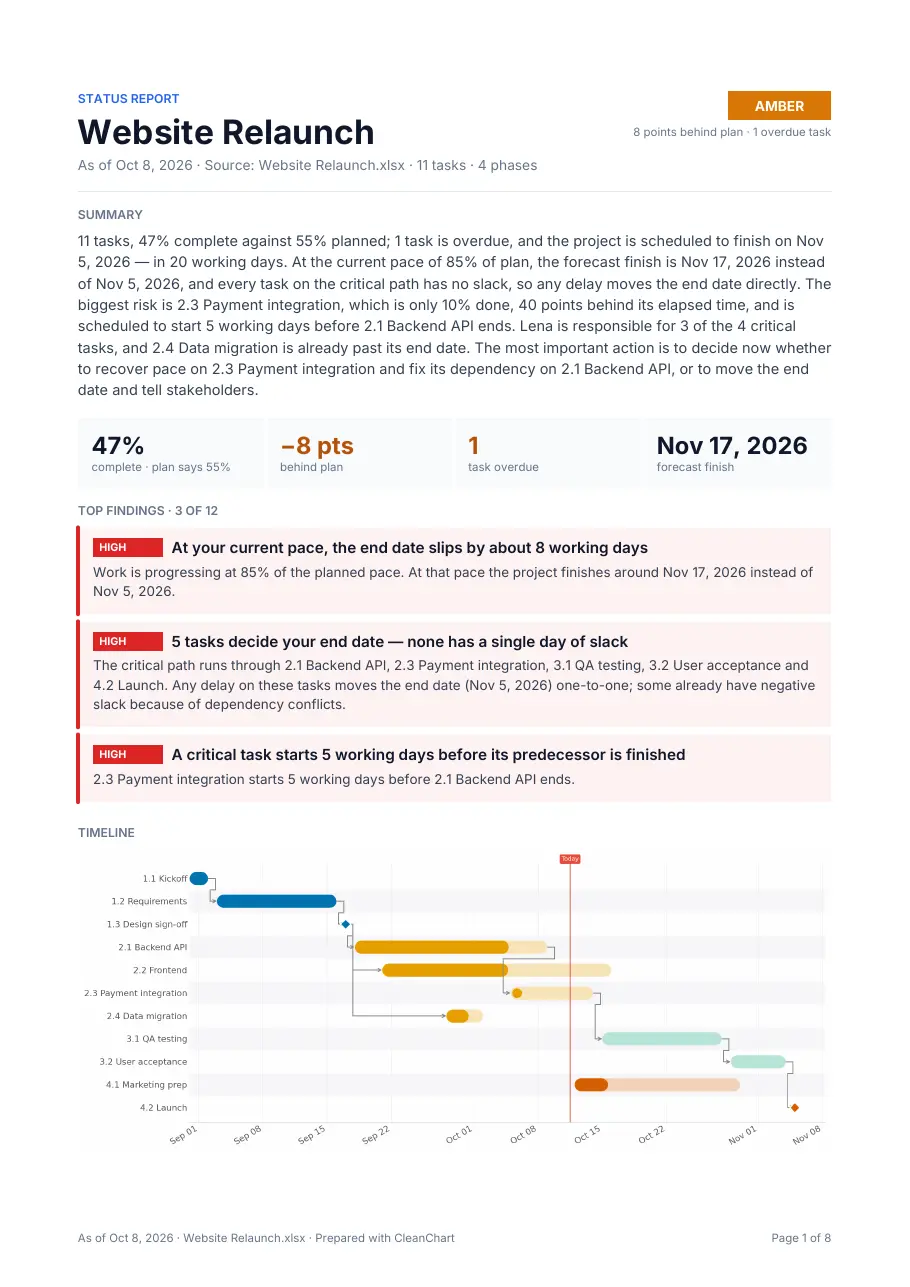
One bar per task, coloured by phase, with today's date marked. Download it and insert it into any slide. Free with a small watermark; clean and high resolution with the Deadline Pass.
A ready-made project deck
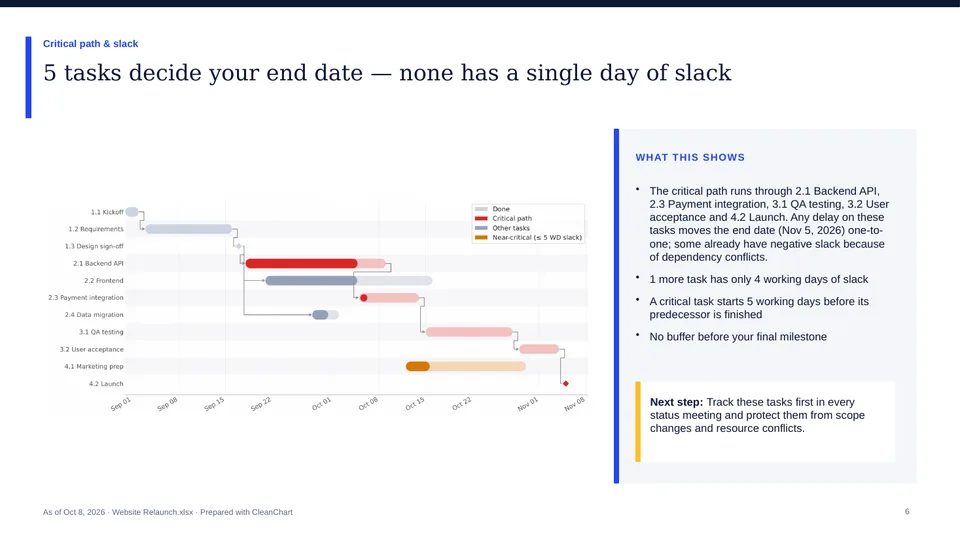
A cover, the status, the top findings and one slide per chart: the timeline and the weekly workload, plus the critical path and progress against plan when your file has those columns.
The status report behind it
The same findings as a PDF and an editable Word file: where the project stands, what is late and what to do about it.
How to get a Gantt chart into PowerPoint
- 1
Upload the plan
An Excel or CSV file with one row per task, a start date and an end date or a duration. Exports from Microsoft Project, Jira or Smartsheet work once they are saved as Excel or CSV.
- 2
Check the Gantt chart
Task, date, phase and progress columns are recognised and the chart is drawn. Change colours, labels or the date format if you need to.
- 3
Put it on your slide
Download the chart as a PNG and insert it in PowerPoint with Insert → Pictures. A clean, high-resolution PNG or an SVG comes with the Deadline Pass ($4.99, 24 hours).
- 4
Or take the whole deck
With 5 or more dated tasks, a free preview shows page 1 of the project report. The report and its PowerPoint deck come with the Deadline Pass or Pro ($19 a month).
What the deck shows about your project
Each slide carries one chart with its main finding as the title. Which charts appear depends on your columns.
- Timeline: The Gantt chart of all tasks, with today's date marked.
- Workload: How many tasks run in parallel each week, and where the peaks are.
- Critical path: With a dependency column: the tasks that decide the end date, and the slack of all the others.
- Progress against plan: With a progress or status column: planned against actual progress, overdue tasks and the forecast finish.
Good to know before you upload
- The chart on your slide is a picture, not a PowerPoint chart object. To move a date, change it in your file and download the chart again.
- The deck uses CleanChart's own layout. Your company template, logo or brand colours are not supported.
- A report needs at least 5 tasks with calendar dates and at most 2,000 rows. A plan written as Week 1 or Sprint 3 gets no report.
- Project reports are written in English.
- There is no link to your project tool: after the plan changes, upload the new export.
Need bars you can drag in PowerPoint?
This page gives you a finished picture of the chart. If you want a chart object you can change bar by bar, build a stacked bar chart in Excel and paste it into PowerPoint. Microsoft shows the steps. Microsoft Support: Present your data in a Gantt chart in Excel
Frequently asked questions
How do I make a Gantt chart for PowerPoint from Excel?
Upload the Excel file with your tasks and dates, check the chart and download it as an image. In PowerPoint, choose Insert → Pictures and place it on the slide.
Is the Gantt chart free?
Yes, with a small watermark at reduced resolution. A clean, high-resolution chart, the project report and the PowerPoint deck come with the Deadline Pass ($4.99, one payment for 24 hours) or Pro ($19 a month).
Can I edit the chart in PowerPoint?
Not bar by bar, because the chart is a picture. Text and tables in the deck are editable. To change the plan, edit your file and download the chart again.
Can I use my company's slide template?
Not for the deck: it uses CleanChart's layout without logos or brand colours. A single chart image fits into any template you already have.
Which columns does my plan need?
A task name, a start date and an end date or a duration. A phase, progress, dependency or owner column is optional; each one adds colours or a part of the report.
Does it work with Microsoft Project or Jira?
Yes, through an export: save the tasks as Excel or CSV and upload that file. The .mpp file itself can't be uploaded.
Guides and related pages
How to create a Gantt chart
The columns, the layout and the common mistakes
Gantt chart from a project export
The guide per project tool
Export charts to PowerPoint
The right format and size for a slide
Excel to Gantt chart
When the chart alone is enough
More reports and decks from a file
Your file is all it takes
Upload it, get the chart free and see page 1 of your report before you decide.
Upload your project plan to start