A JSON file turns into a Gantt chart the moment it's an array of objects with a task name and two dates (or a start date plus a duration). Upload it to the JSON to Gantt chart converter, and CleanChart detects the date fields and draws the timeline automatically — no schema to write, no parsing script, and no detour through a spreadsheet first.
That's the short version. The rest of this guide covers the exact JSON shape CleanChart expects, what to do when your export is nested or wrapped in an outer object, a full walkthrough with screenshots from the real upload flow, and how JSON compares to the other formats people actually use for Gantt charts, based on CleanChart's own usage data.
What JSON Structure Does a Gantt Chart Need?
A Gantt chart needs one task per array element, with a label and either two dates or a date plus a duration. A minimal JSON file looks like this:
[
  { "task": "Kickoff meeting", "start": "2026-09-01", "end": "2026-09-02" },
  { "task": "Design review", "start": "2026-09-03", "end": "2026-09-09" },
  { "task": "Build", "start": "2026-09-10", "end": "2026-09-24" }
]
CleanChart doesn't require exact key names. It scans the objects in the array for two fields that parse as dates and a text field that doesn't, then offers that combination as the Gantt chart mapping. Useful optional fields, the same ones a CSV or Excel task list would carry:
- A duration field instead of an end date, if that's what your source system exports (CleanChart converts days, weeks or months into an end date).
- A group or category field (team, sprint, phase), so CleanChart colors bars by this field automatically once you map it.
- A percent-complete field to render progress bars inside each task.
None of these are required. A bare array of task/start/end objects is enough for a working chart; everything else is refinement you can add afterward in the chart editor.
Step-by-Step: JSON to Gantt Chart
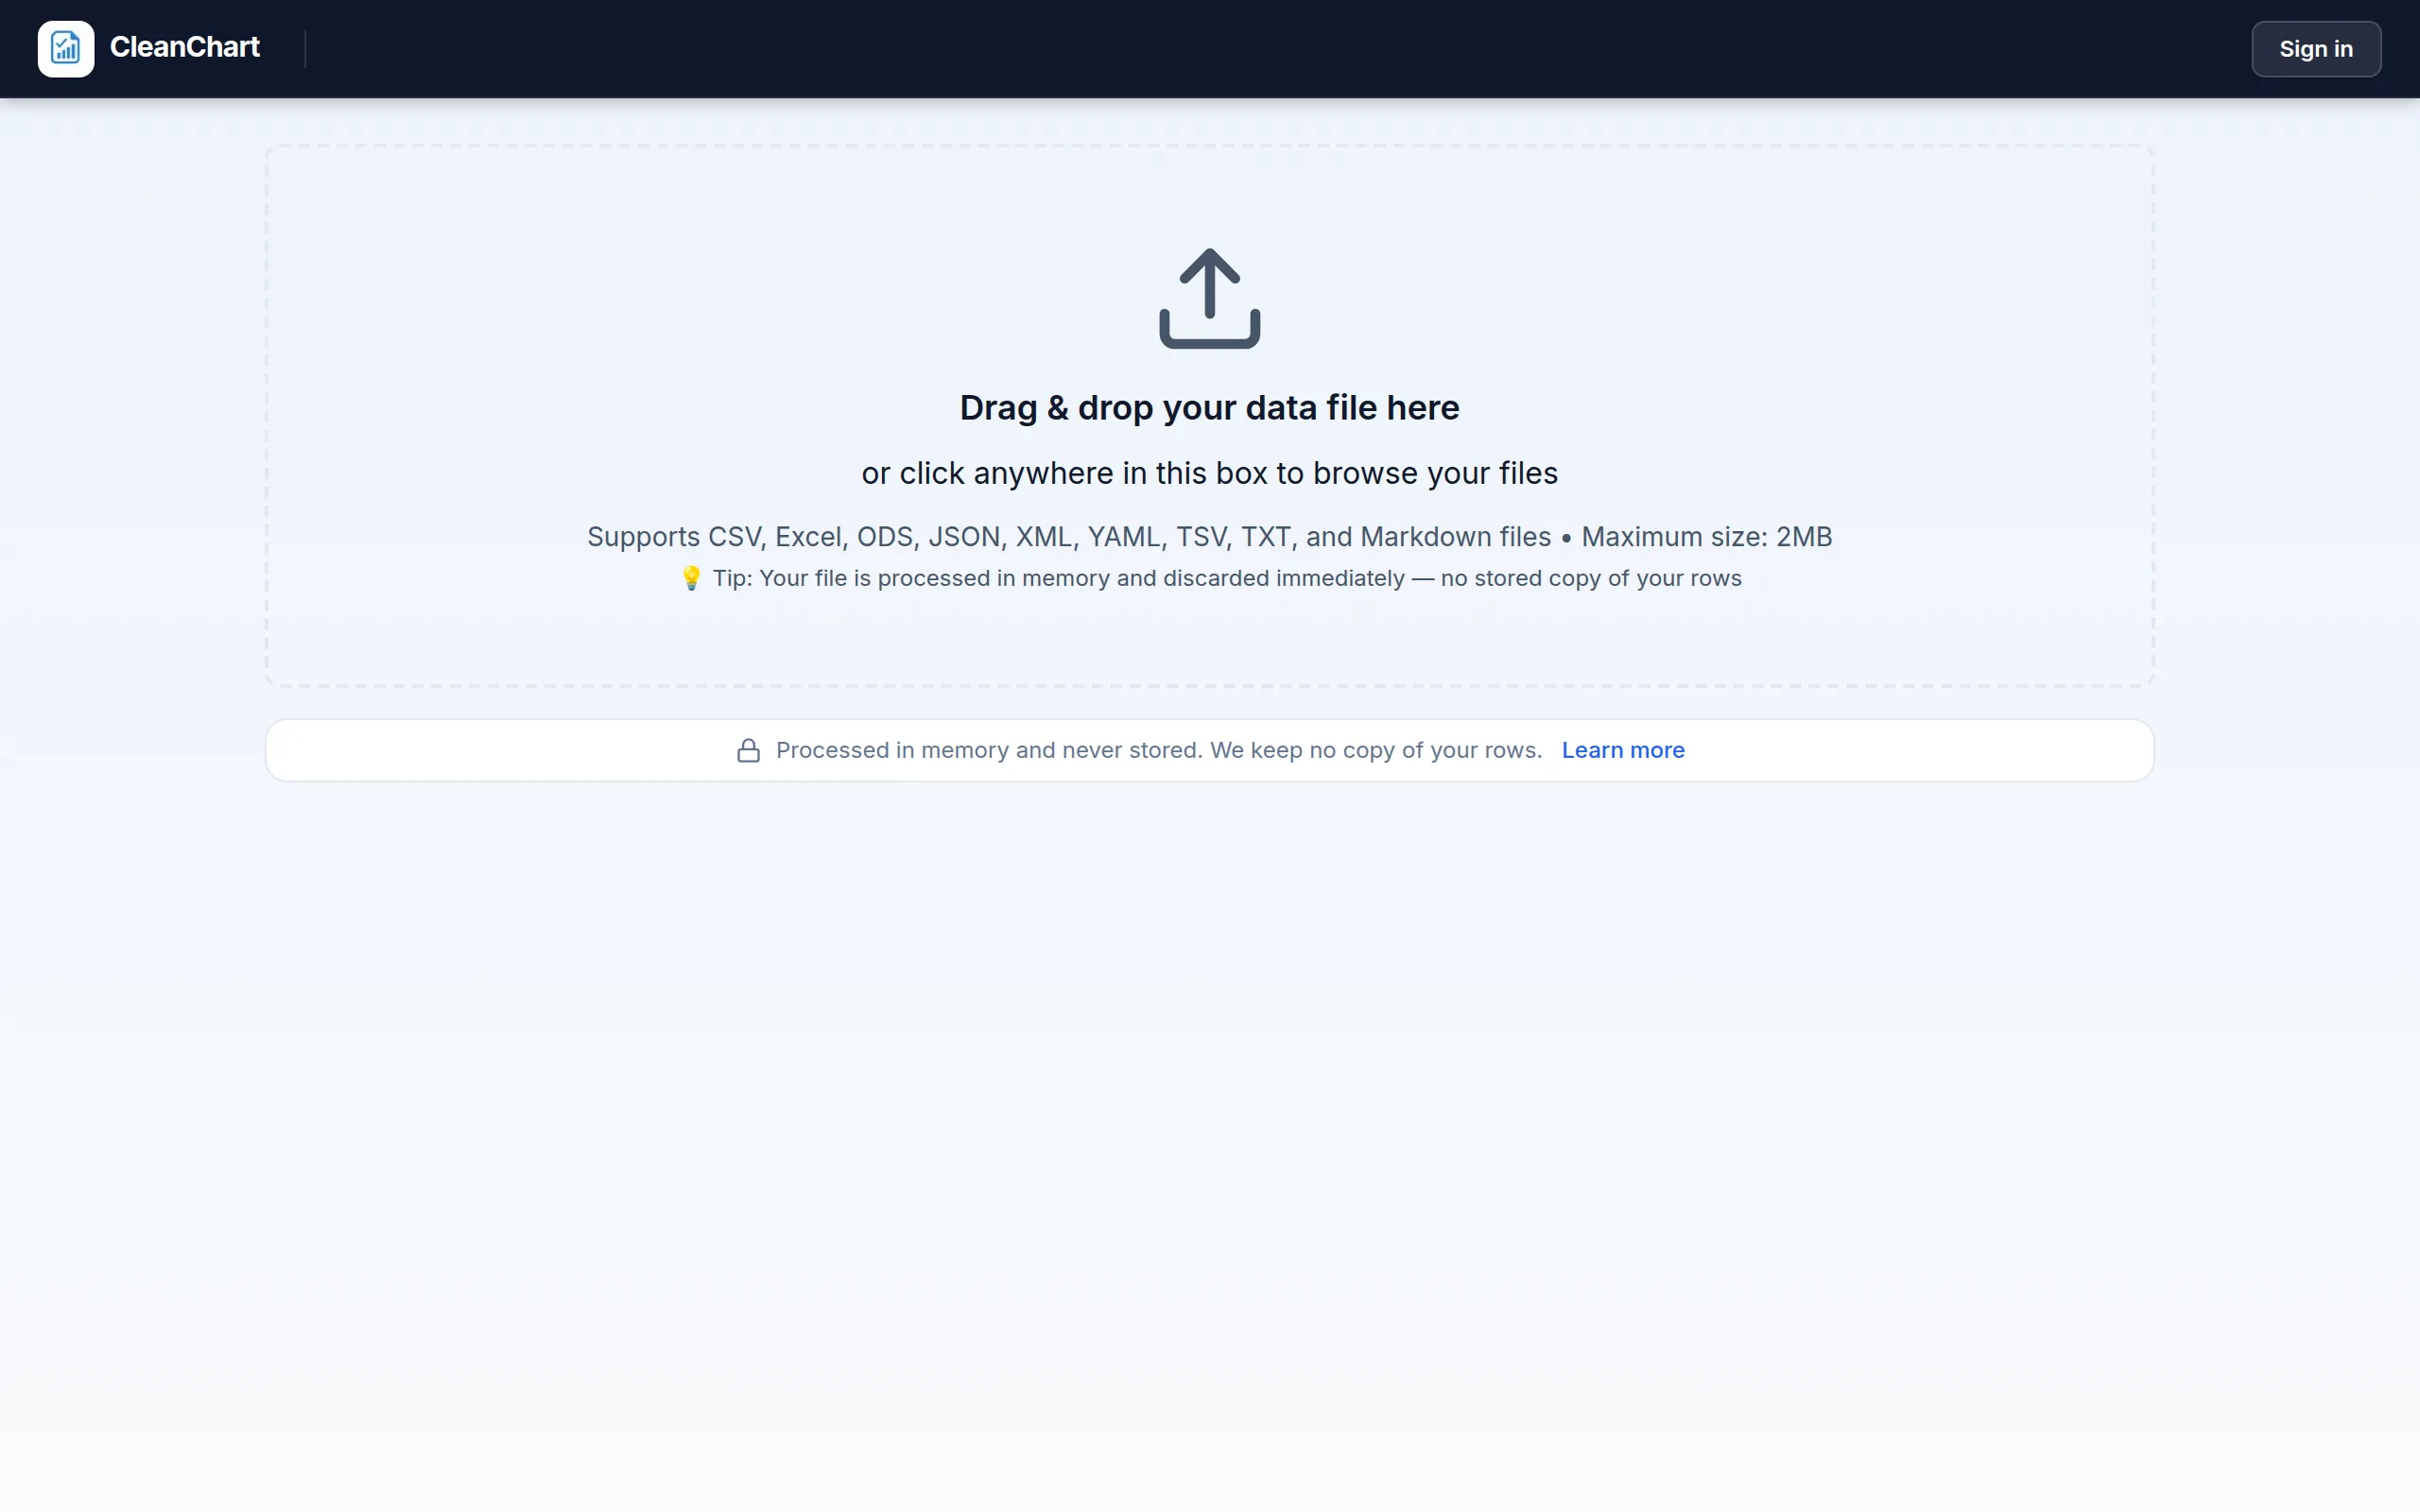
Here's a five-task JSON file, the same shape as the example above, uploaded to CleanChart's JSON to Gantt chart converter.
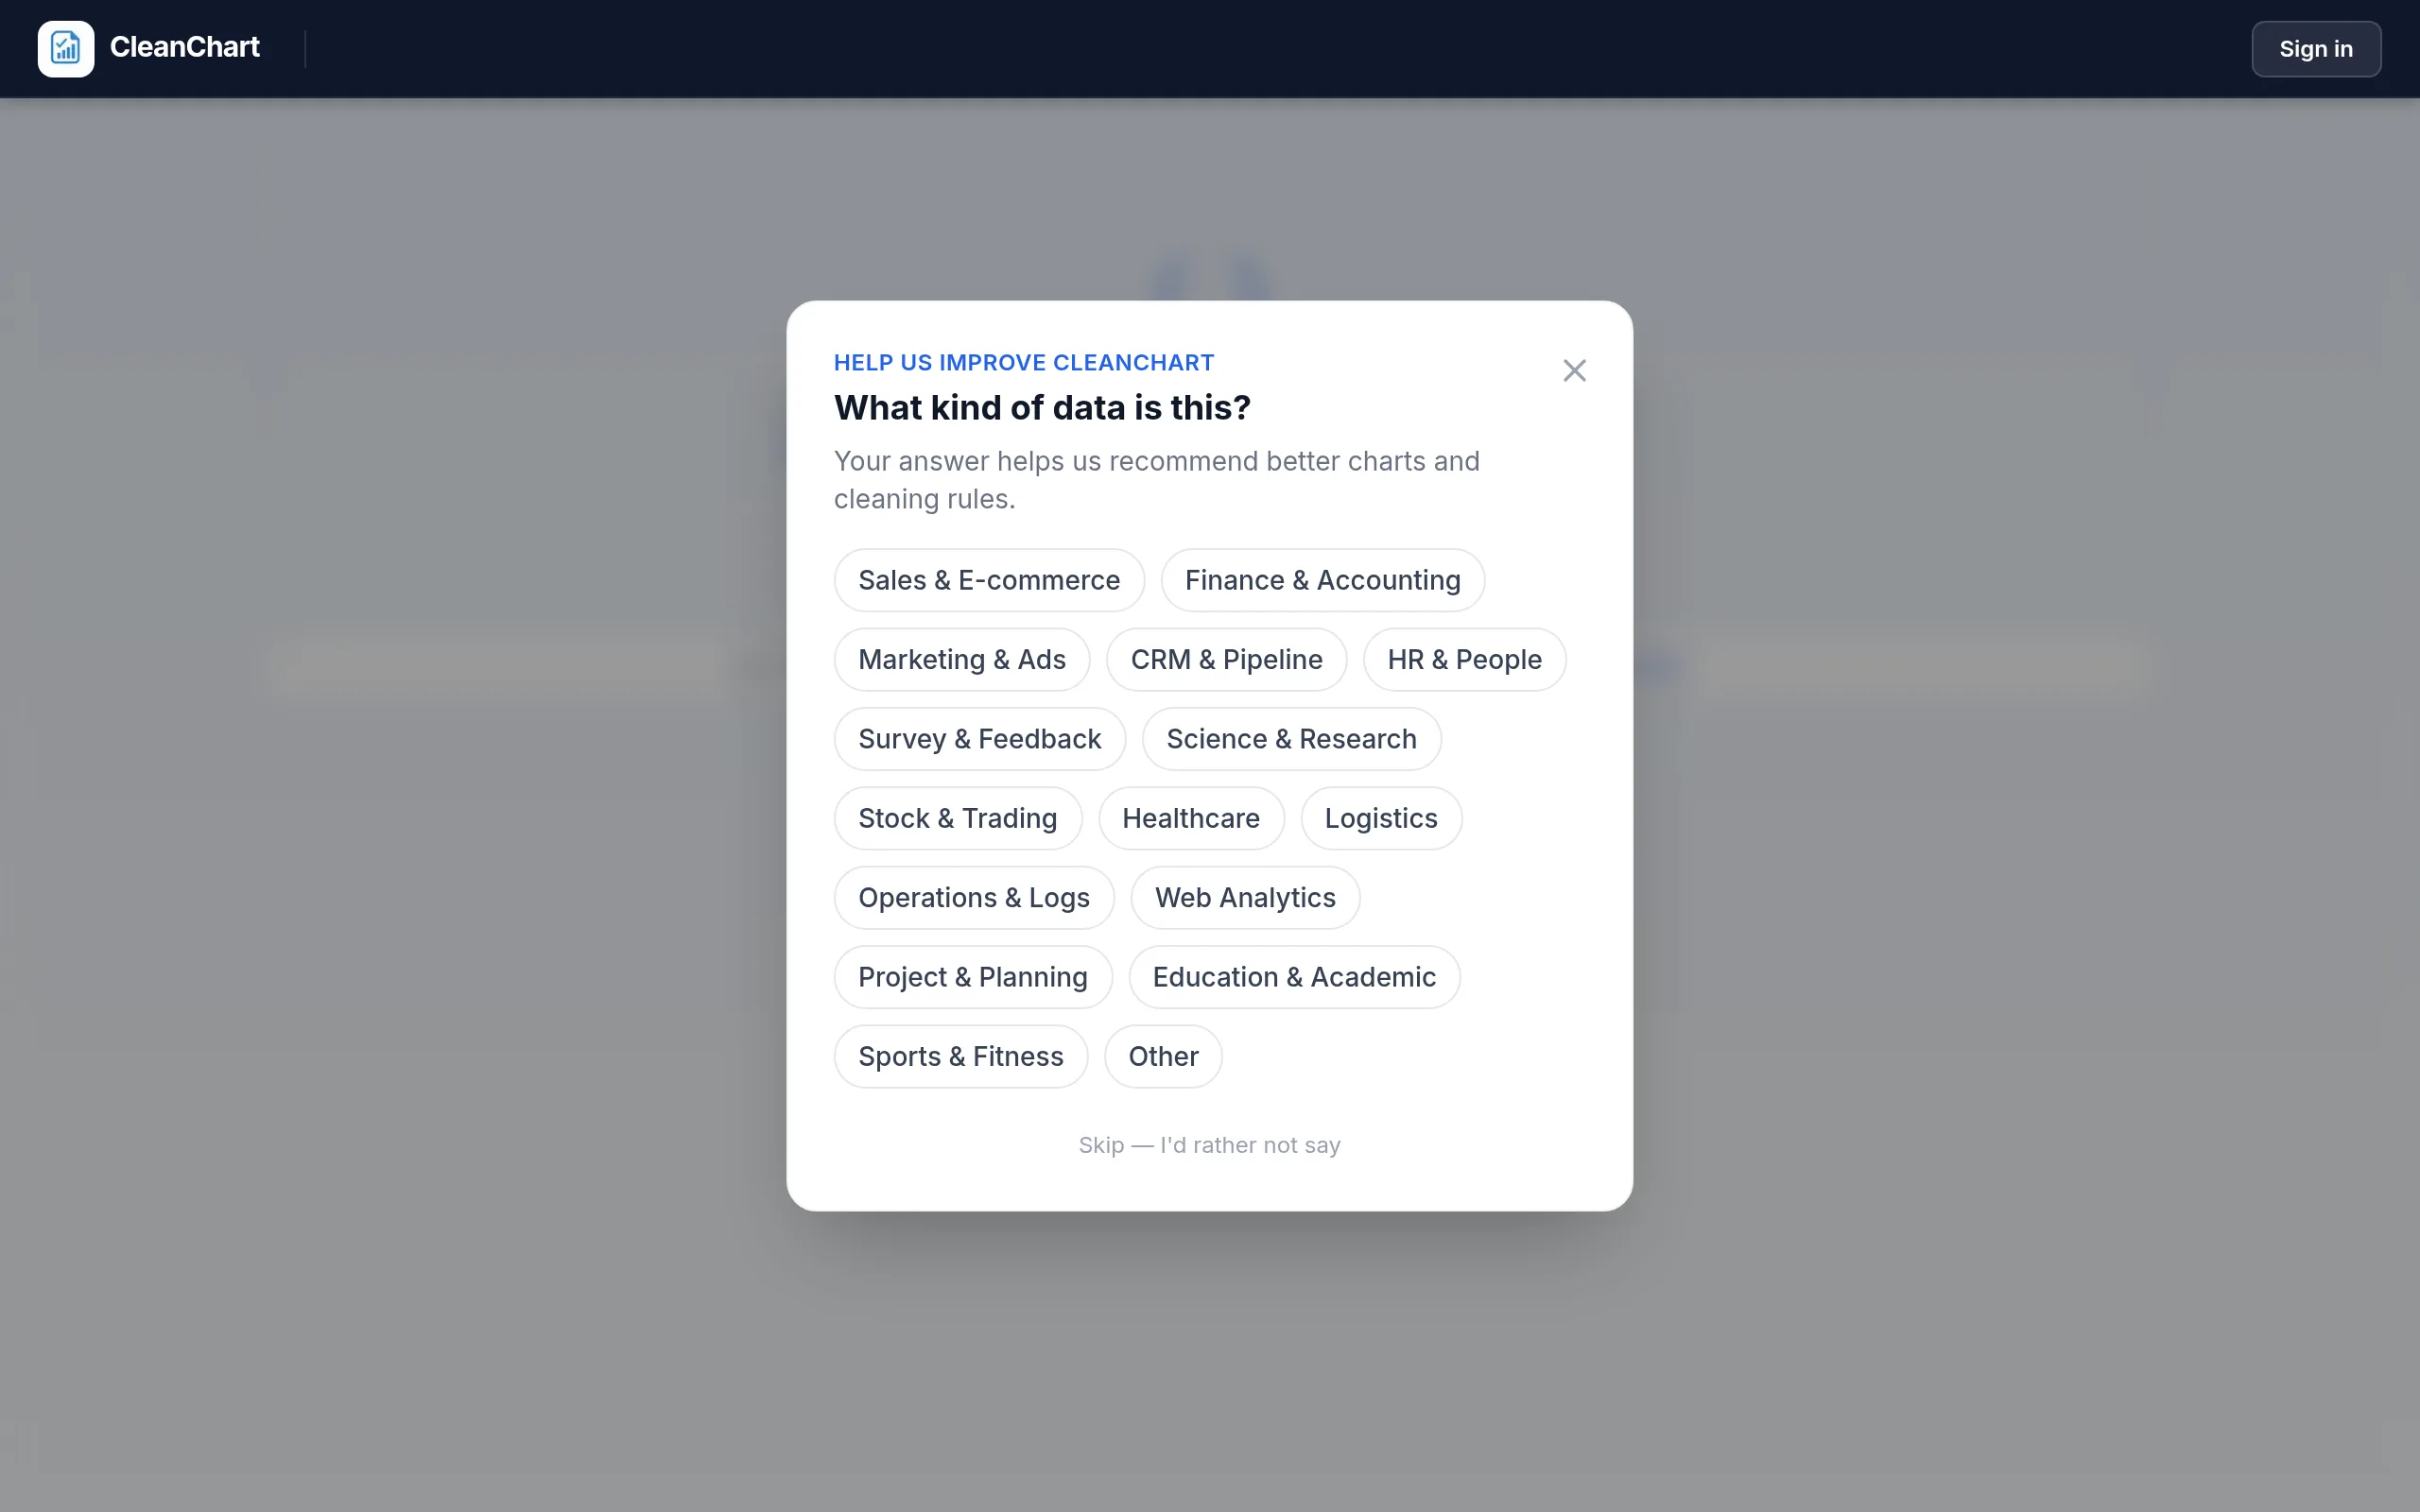
CleanChart asks what kind of data you uploaded so it can tune its chart recommendation. Picking Project & Planning is what points a task-plus-two-dates file at the Gantt chart type instead of, say, a line chart of the dates.
CleanChart maps task to the row label and start / end to the timeline, rendering each entry as a rounded bar (or a dot, for a single-day task like the kickoff meeting) on a daily axis.
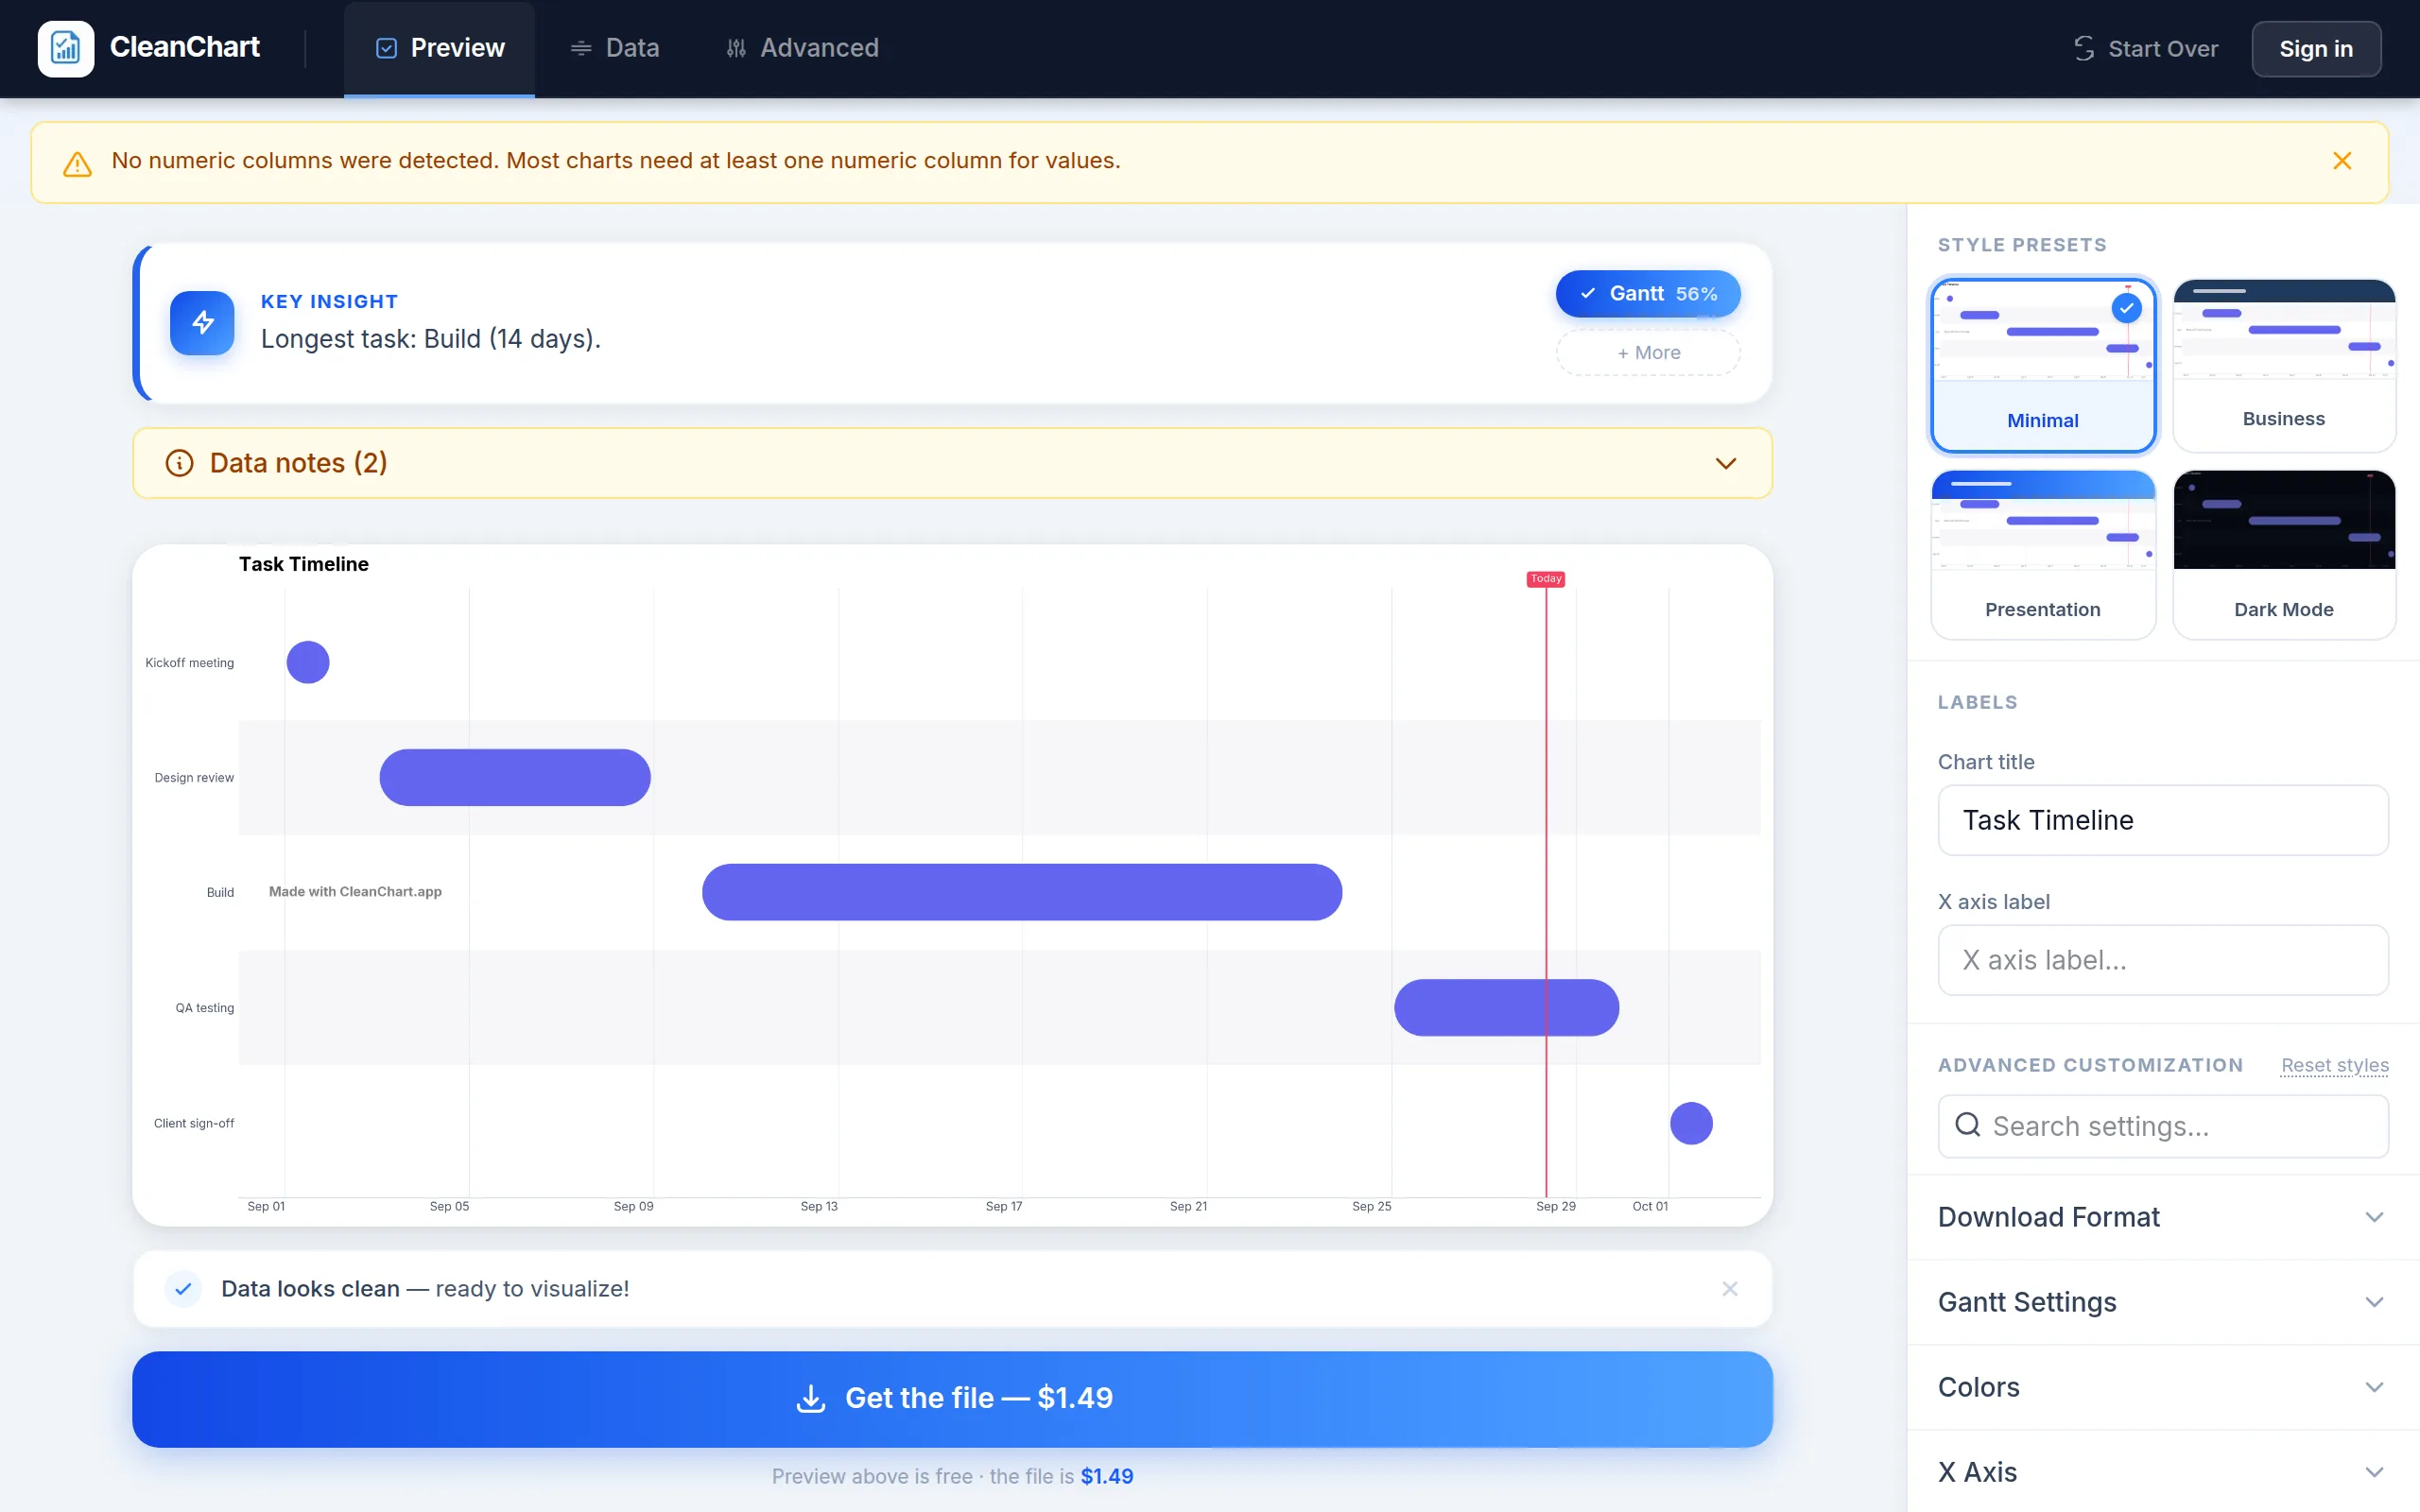
Export as PNG for a slide or status update, or SVG if you'll resize it in a document later. The free tier exports with a watermark at reduced resolution; a subscription or a 24-hour pass removes the watermark and unlocks full-resolution PNG, SVG and PDF. Want to try the same file first? download the five-task sample JSON used in the walkthrough above.
How Common Is JSON as a Gantt Chart Source?
Less common than a spreadsheet export, but a real and fully supported minority. Across every Gantt chart CleanChart has rendered from May to October 2026, Excel workbooks and CSV files together account for the large majority of uploads.
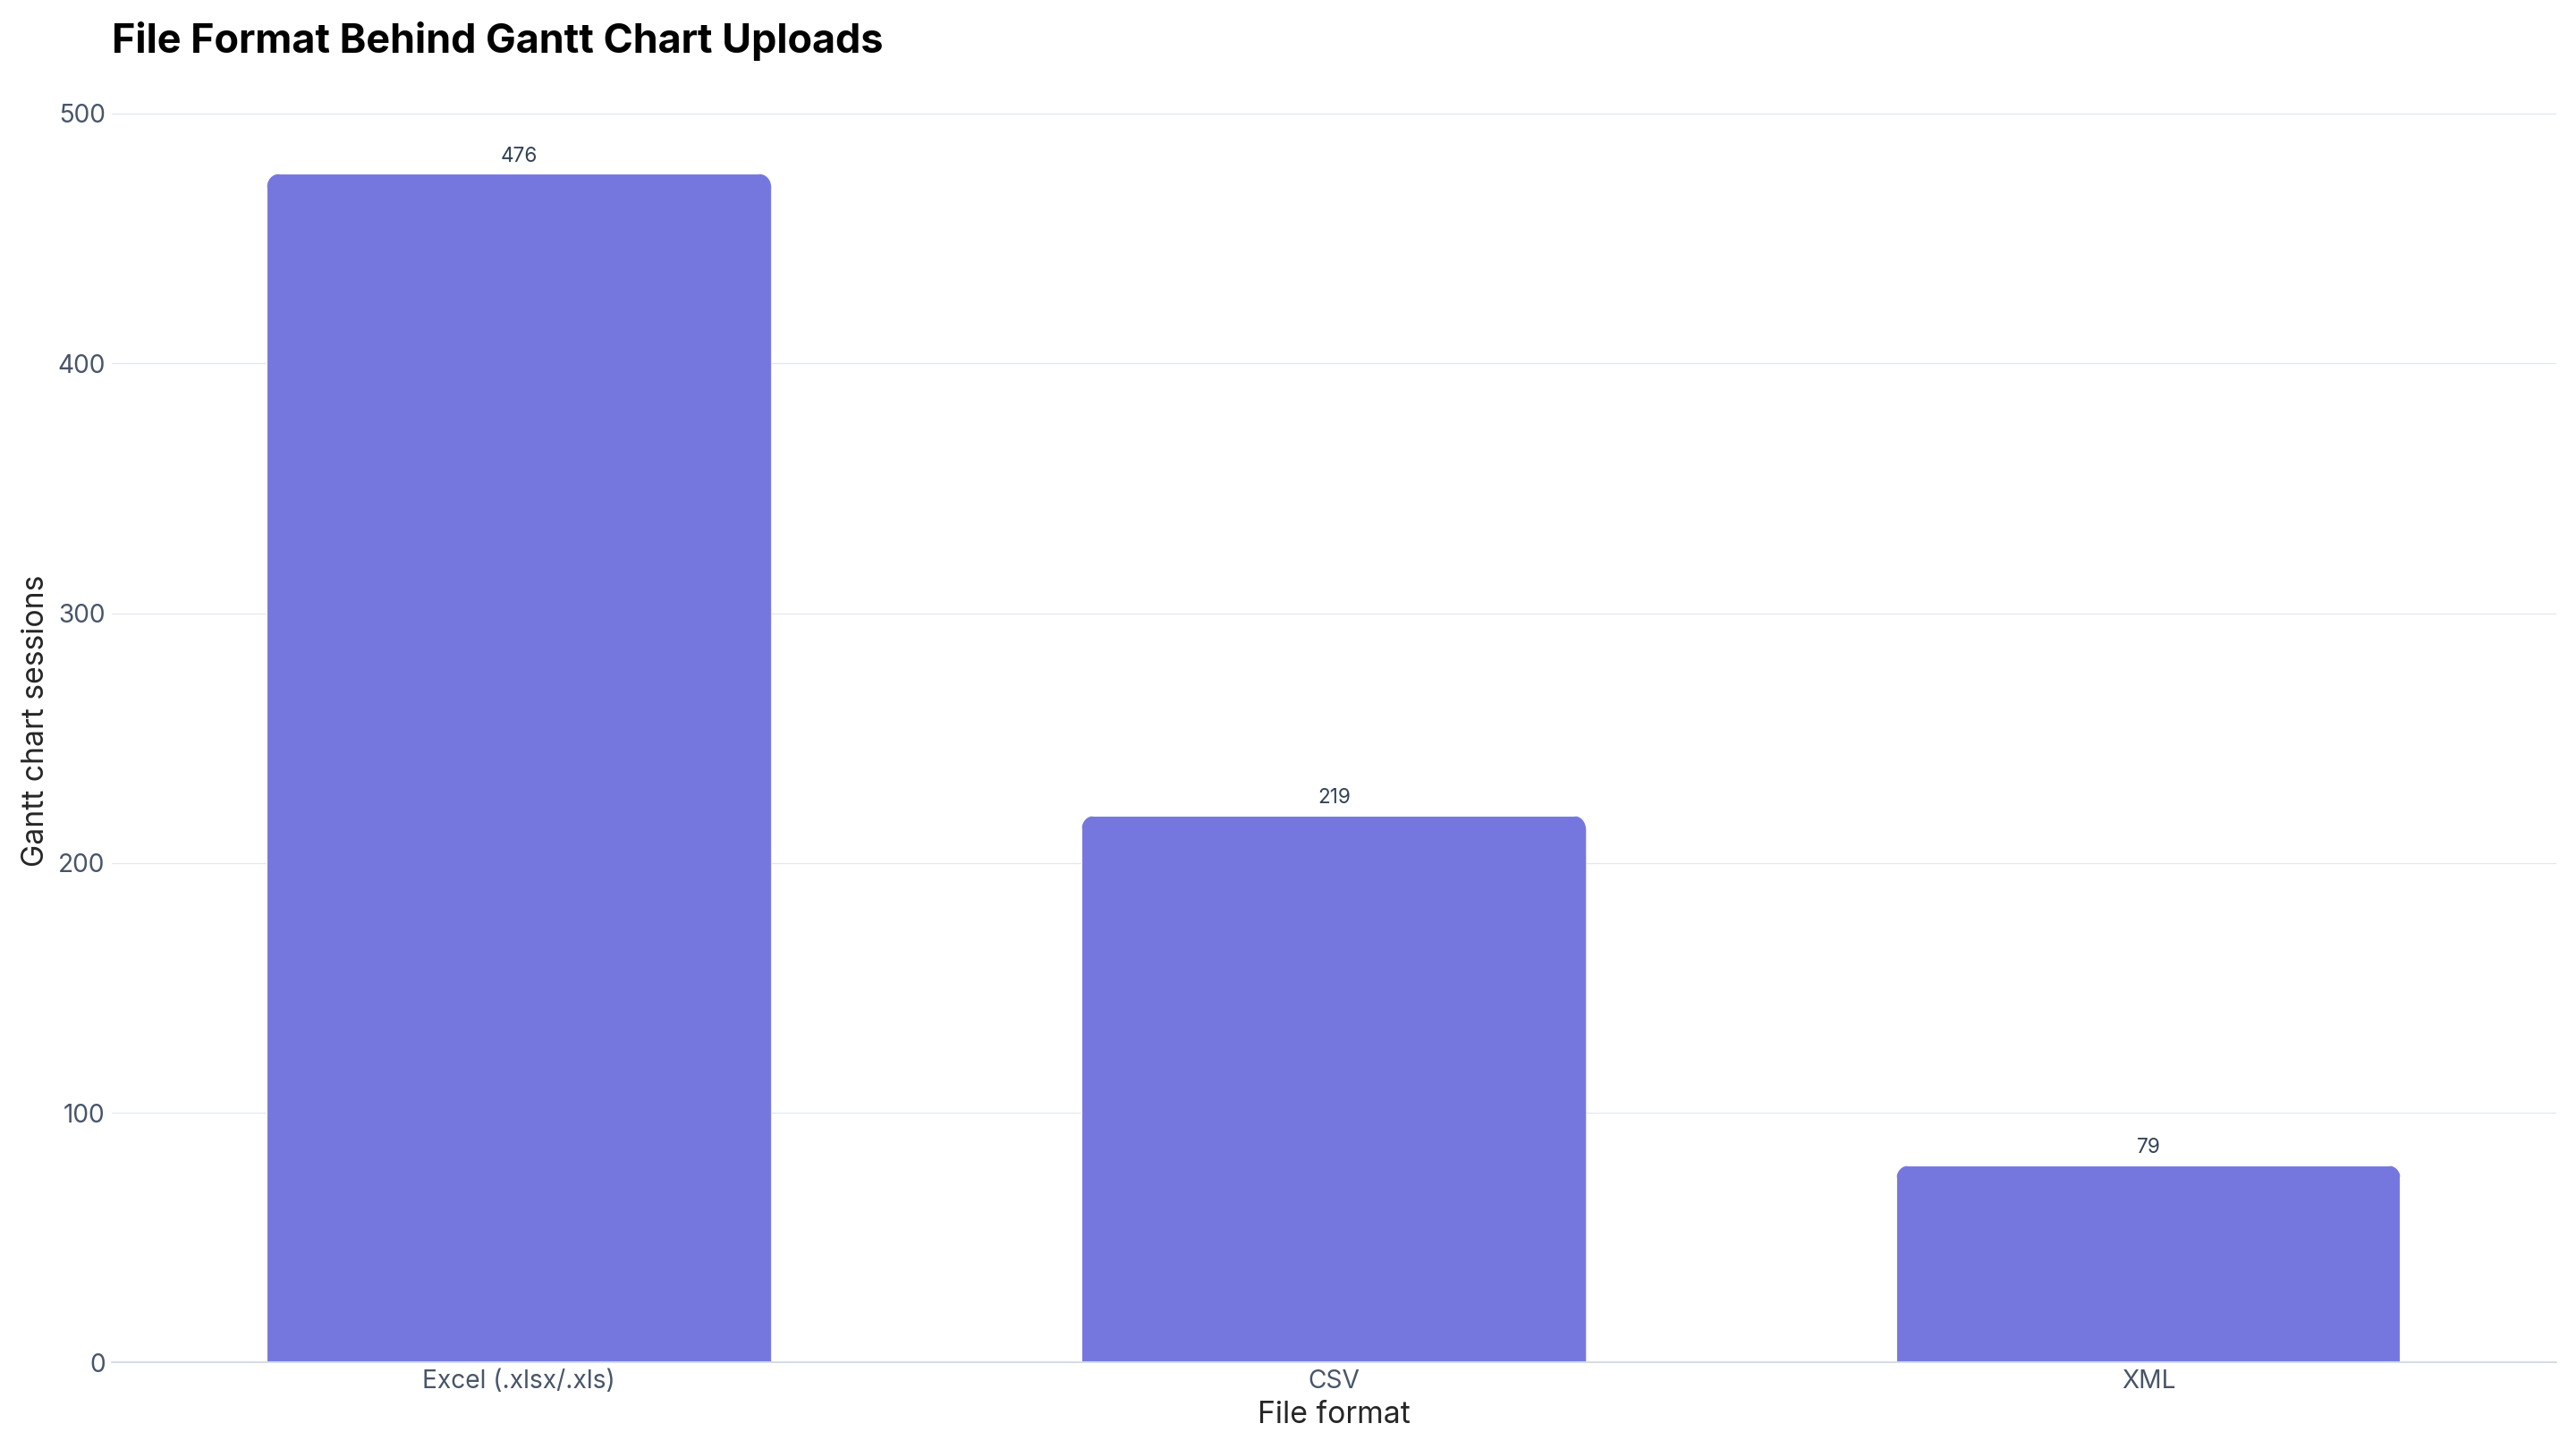
Practically, this means JSON-sourced Gantt charts usually come from one place: an API response, a database export, or a script's output, rather than something typed by hand. The upload flow and the resulting chart are identical either way — the format just changes how the file was produced.
Common Problems When Charting a JSON Task List
The array is wrapped in an outer object
Many APIs don't return a bare array; they return something like a top-level object with a "tasks" or "data" key holding the array. Extract the inner array before uploading, or the file may not parse as one row per task.
Inconsistent keys across objects
If one object uses "start" and another uses "startDate", CleanChart can't reliably treat them as the same field. Normalize key names across every object in the array before uploading; a quick find-and-replace in a text editor is usually enough for a hand-exported file.
Dates stored as nested objects or Unix timestamps
Some APIs return a date as an epoch number or a nested object (for example, a Date field with separate year, month and day keys) rather than a string. CleanChart's automatic cleaning parses common date-string formats, but a raw timestamp or a nested date object should be converted to an ISO date string ("2026-09-01") before upload.
Missing end dates or durations
An object with a start date and nothing else has no end point to plot. Either add an end date (or a duration field) for every task before exporting, or expect that entry to be dropped from the chart.
Too many tasks for a readable chart
A Gantt chart reads best with roughly 8–20 tasks. A JSON export with hundreds of records, a full project backlog pulled from an API, say, produces a chart with more bars than anyone can read at a glance. Filter to one phase, sprint or milestone group before charting the whole array.
What About CSV, Excel, or Jira?
Everything above applies to JSON specifically, but the underlying process (task label, start, end, optional group and progress fields) is the same whatever the source. For a plain-text task list, the CSV to Gantt chart guide covers the same walkthrough for a CSV file, and the Excel to Gantt chart converter handles a workbook directly.
Teams exporting sprint or backlog data from an issue tracker get a full walkthrough in the Jira export guide. And if your JSON is nested or nothing like the flat array this guide describes, JSON to Chart covers reshaping it before charting.
Frequently Asked Questions
Can I make a Gantt chart directly from a JSON file?
Yes. Upload a JSON array of task objects to CleanChart's JSON to Gantt chart converter and it renders in the browser tab — no schema, no separate parsing step, no spreadsheet conversion first.
What JSON structure does CleanChart expect for a Gantt chart?
A flat array of objects, one per task, where each object has a text label and either two date fields or a date plus a duration field. A group field for color-coding and a percent-complete field for progress bars are optional additions.
My JSON is nested inside a larger object. Will that work?
Not directly. If the array of tasks sits under a key like "data" or "tasks" inside a larger response object, extract that inner array into its own file before uploading.
Can I use a duration instead of start and end dates?
Yes — map a duration field (in days, weeks or months) instead of an end date, and CleanChart calculates the end point from the start date and duration.
Does the free plan work for a JSON Gantt chart?
Yes — uploading, chart generation and PNG export are free, with a "Made with CleanChart.app" watermark and reduced resolution. A subscription or a 24-hour pass removes the watermark and unlocks full-resolution PNG, SVG and PDF export.
Related CleanChart Resources
Gantt Chart Tools
- JSON to Gantt Chart Converter – Upload any JSON task array directly
- CSV to Gantt Chart Converter – Same flow for a plain-text task list
- Excel to Gantt Chart Converter – Same flow for .xls/.xlsx workbooks
- Gantt Chart Maker – Build a Gantt chart from any data
Related Blog Posts
- How to Create a Gantt Chart: Step-by-Step – The general-purpose guide
- CSV to Gantt Chart: A Step-by-Step Guide – The same flow starting from CSV
- How to Turn a Jira Export Into a Gantt Chart – The same flow starting from Jira
- JSON to Chart – Reshaping nested JSON before charting
External Resources
- Wikipedia: Gantt Chart – History and detailed explanation of Gantt charts
- RFC 8259: The JSON Data Interchange Format – The official JSON specification, useful for understanding valid structure and date representation
Last updated: October 1, 2026