
What goes into a financial report Excel template?
Most financial report templates you can download cover the same parts: an income statement (profit and loss by month), a balance sheet, a cash flow statement, a KPI dashboard and an executive summary with room for comments. The first three are the formal statements your accountant produces. The last two are what your manager or client actually reads.
| Part | What it answers | Built from |
|---|---|---|
| KPI tiles | How much came in, what was left, up or down? | Revenue total, gross margin, change against the previous period |
| Income statement (P&L) | Where did the money come from and go? | Revenue and costs per month, per business line or account |
| Margin trend | Which part of the business earns less than it used to? | Gross margin per business line per month or quarter |
| Breakdown | How dependent are we on one line or customer? | Share of revenue per business line |
| Summary and recommendations | What should we do about it? | Written by hand from the points above |
The layout is the easy part. The hard part is the last row: reading 20 months of numbers and saying in three sentences what changed and why it matters. That's the part no downloaded template does for you.
How should the Excel sheet behind the report look?
Keep the data apart from the report. One sheet holds the raw figures in a long, flat table; every chart, KPI and summary is calculated from it. That way next month you add rows instead of rebuilding the layout.
- One header row. Month, Business line, Revenue, Cost of sales. No merged cells and no title rows above the header.
- One row per month and business line. Four lines over 22 months make 88 rows. Don't put months side by side in columns.
- One date format for the whole column. "Jan 2025" or 2025-01-01, but not both.
- No totals or subtotals inside the table. Totals belong in the report, not in the data, or they get counted twice.
- Plain numbers. Store 124240, not "124,240 USD" as text. The currency goes into the column name if you need it.
In Excel, a PivotTable turns this flat table into the P&L view by month and business line, and a calculated field gives you the margin. If your accounting tool exports something messier, the guide to cleaning CSV data covers stray header rows, numbers stored as text and mixed date formats.
We built a sample file in exactly this shape for the example below: a fictional services company with four business lines (Consulting, Software subscriptions, Training and Hardware resale), monthly revenue and cost of sales from January 2025 to October 2026. Download the sample file (CSV) and use it as your starting layout.
Which chart shows the margin trend best?
A line chart with one line per business line. Revenue totals hide what's happening underneath; gross margin per line shows which part of the business is quietly getting less profitable. Quarterly points are easier to read than monthly ones when you have two years of data.
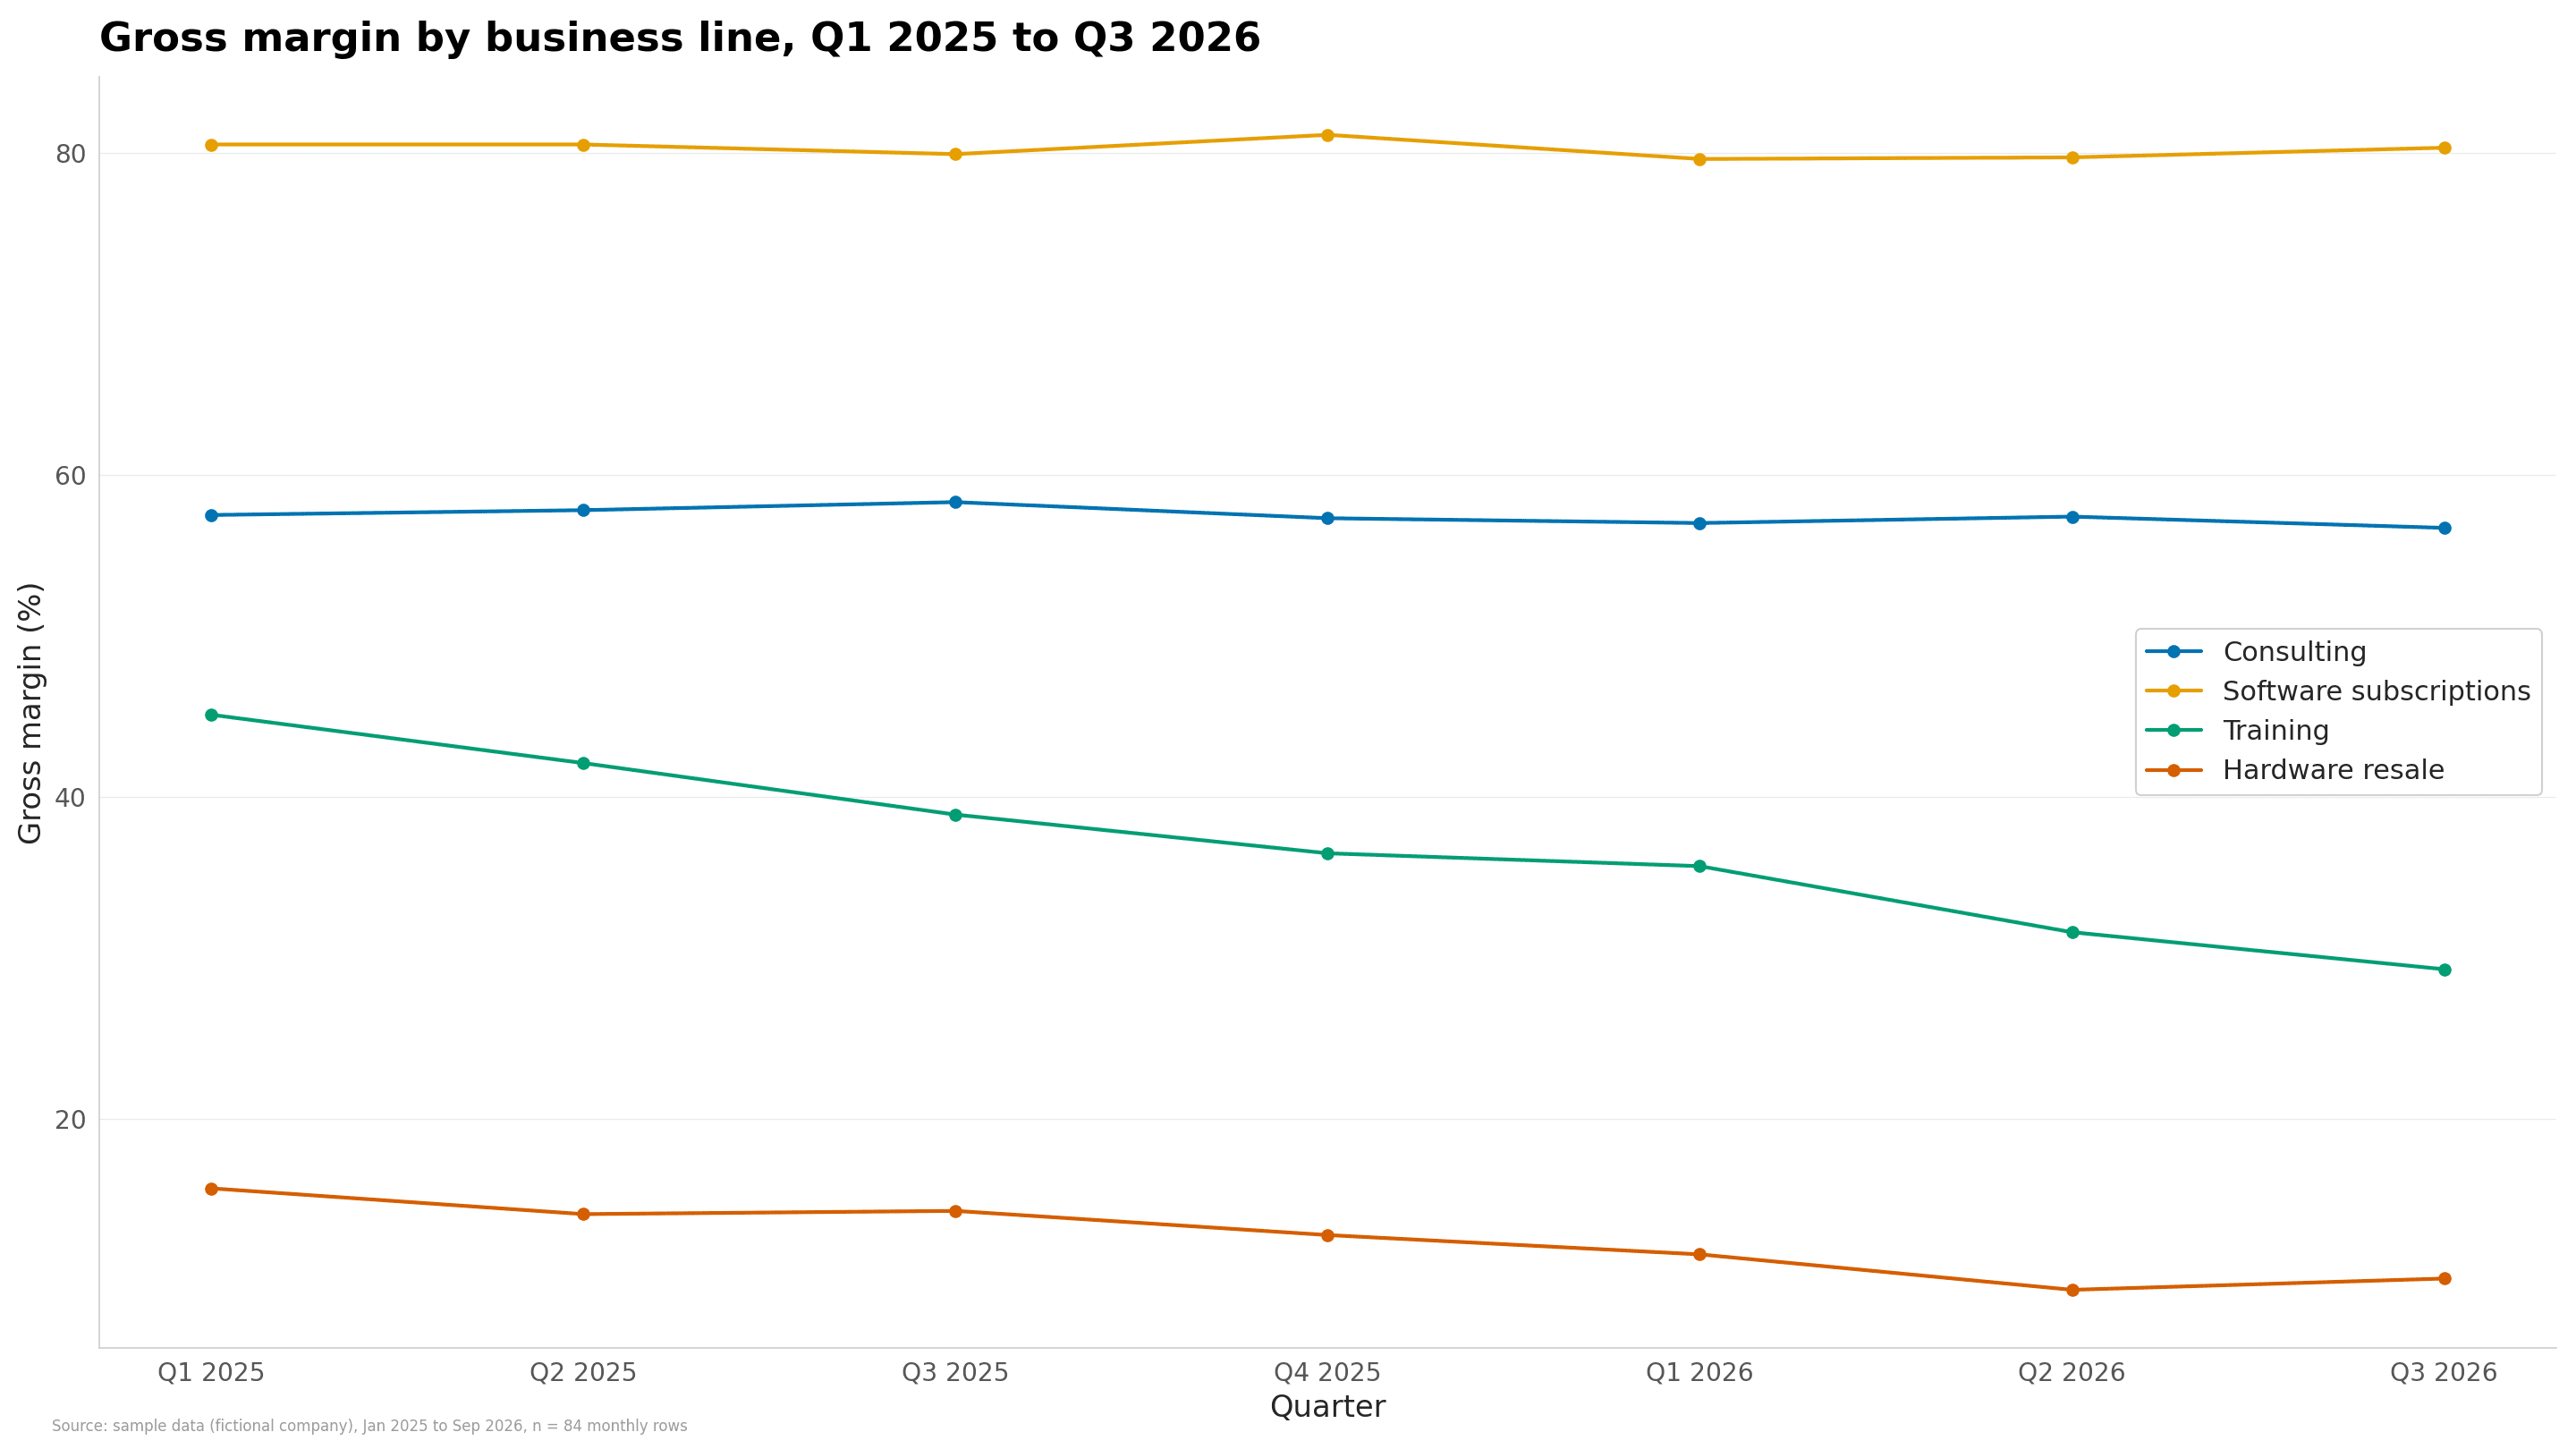
Two lines stay flat and two go down. Training loses 16 points of margin in seven quarters, which a total revenue chart would never show, because the company's revenue grew over the same time. To build this chart from your own sheet, upload it to the line chart maker or go straight from the workbook with Excel to line chart, pick Month as the x-axis and the business line as the series. For a bridge from one period's profit to the next, a waterfall chart is the better pick.
What does a finished report from this file say?
We ran the CleanChart report engine on the sample file (88 rows, four business lines, January 2025 to October 2026) to see what it finds without any help. These are the findings it returned, word for word, in the order it ranked them:
| Severity | Finding | Recommendation |
|---|---|---|
| High | One business line's margin fell from 45% to 29%. Training: gross margin 45% in Jan – Mar 2025, 29% in Aug – Oct 2026. Costs rose faster than revenue. | Review purchase prices and discounts for Training — at this trend it stops covering its costs. |
| High | Revenue: the last 3 months are 9% below the 3 months before. 377k per month in Aug – Oct 2026 against 414k in May – Jul 2026. | Check what changed in the most recent periods (prices, volume, one-off events). |
| High | One business line brings 41% of total revenue. Consulting: 3.25M of 7.97M. | Consulting carries a large part of the total — protect it, and reduce the dependence over time. |
| Medium | Revenue grew 18% from the first to the last 3 months. 320k per month on average in Jan – Mar 2025, 377k in Aug – Oct 2026. | Split the change by business lines to see whether it is broad or carried by a few. |
| Medium | One business line's share rose from 26% to 34%. Software subscriptions: 26% of the total in the first 3 months, 34% in the last 3. | Check whether the shift is intended (focus, pricing) or a loss elsewhere. |
The KPI tiles it put on page 1: 7.97M revenue over 22 months, +18% first against last periods, 54% gross margin, and the best month (shown only after purchase). The amounts carry no currency sign because the sample's columns don't name one.
Notice the second and fourth findings. Revenue is up 18% over the whole period and down 9% over the last quarter. Both are true, and a report that shows only one of them misleads. That tension is exactly what the summary at the top should explain.
How do you write the summary at the top?
Three to five sentences, numbers first, no adjectives the numbers don't support. Using the findings above, a summary for this file could read:
"Revenue reached 7.97M over 22 months at a 54% gross margin, up 18% from the first to the last quarter, but the last three months were 9% below the three before. Software subscriptions now bring 34% of revenue, up from 26%. Training's margin fell from 45% to 29% because its costs rose faster than its revenue; at this trend it stops covering its costs. We recommend reviewing Training's prices and discounts this quarter."
- Lead with the total and the margin. That's what every reader looks for first.
- Name the good news and the bad news. A growing total and a falling recent quarter belong in the same paragraph.
- End with one action. If the reader remembers one sentence, make it the recommendation.
Can you build the report from your Excel file without a template?
Yes. Instead of copying your numbers into someone else's workbook, upload the sheet you already have. CleanChart reads CSV, Excel (.xls and .xlsx) and ODS files, cleans duplicates, gaps and mixed date formats on upload and suggests a chart. The chart is free with a small watermark.
- Upload the file on the Excel report generator page. Your sheet needs 10 to 20,000 rows.
- Check the free preview. It shows how many findings the data holds and page 1 with the top finding in full.
- Pick the questions. Choose 2 to 10 from the list your columns can answer, for example the margin trend or the share per business line.
- Set the title and reader. Name the report, add a 'Prepared by' line and choose who reads the summary: a manager, a client or a thesis committee.
- Download. You get a PDF, an editable Word file and an editable PowerPoint deck. The charts in the deck are pictures; text and tables can be edited.
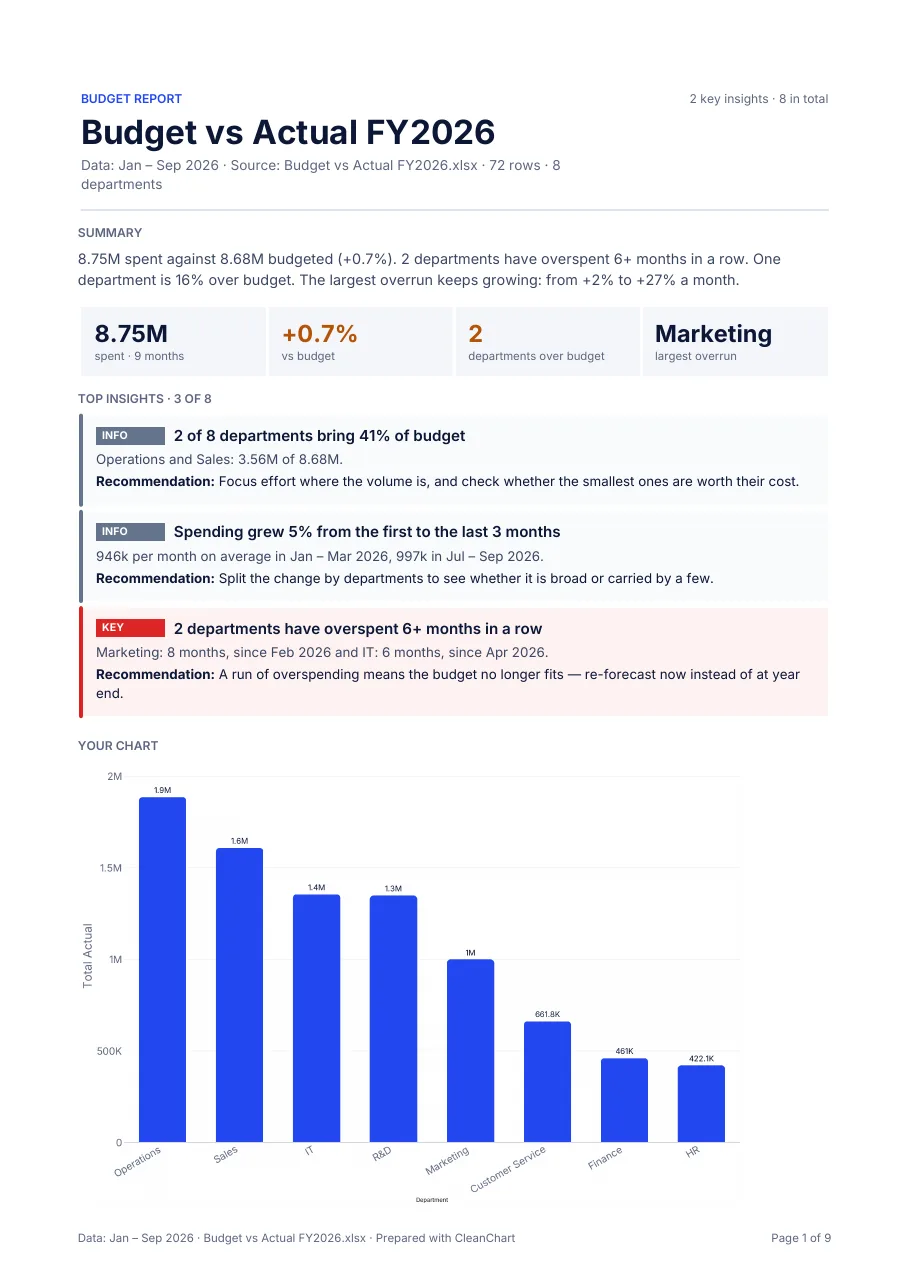
If your sheet compares spending with a budget, the budget vs actual report page is the better start. For a file of orders and customers, see the sample sales report (PDF) and the Excel sales report guide. The full path from any spreadsheet to a finished report is in the spreadsheet to report guide.
What can't a generated financial report do?
- It doesn't produce your balance sheet or cash flow statement. It analyses the columns you upload; it doesn't do bookkeeping.
- No forecasts beyond a labelled trend line, and no outside data. Every number comes from your file.
- No Excel output. You get PDF, Word and PowerPoint, not a workbook with formulas.
- No custom templates, logos or brand colours. Every report uses CleanChart's own layout.
- No scheduled reports. You generate one when you need it and download it; it isn't saved in your dashboard.
Charts are free and unlimited with a small watermark. The full report, with the Word file and the PowerPoint deck, comes with the Deadline Pass ($4.99, one payment, 24 hours) or Pro ($19 a month); see the pricing page. For more chart ideas for money data, read visualising financial data.
Keep reading
Frequently Asked Questions
What should a monthly financial report include?
At minimum: revenue, costs and gross margin for the month and the year to date, the change against the previous period, a breakdown by business line or account, a margin trend chart and a short written summary with one recommendation.
How should I lay out my Excel data for a financial report?
Use one flat table with one header row and one row per month and business line or account, with revenue and cost in their own columns. Keep totals out of the data sheet and calculate them in the report.
Can CleanChart make a balance sheet or cash flow statement?
No. It charts and analyses the columns you upload, such as revenue and cost per month, and writes findings from them. The formal statements come from your accounting system.
Is the financial report from CleanChart free?
The chart and the preview of page 1 are free. The full report as PDF, Word and PowerPoint comes with the Deadline Pass ($4.99 for 24 hours) or Pro ($19 a month).