Free online converter
Convert TXT to Bubble Chart
Transform your TXT data into beautiful Bubble Charts in seconds. No coding required - upload your data and create professional charts instantly.
Upload your TXT file — the Bubble Chart is built from it in seconds
Chart type pre-selected: Bubble Chart. No stored copy of your rows, no hosted copy of your chart. No account needed.
| X | Y | Size |
|---|---|---|
| 10 | 20 | 5 |
| 15 | 35 | 12 |
| 20 | 28 | 8 |
Data report · PDF, Word & PowerPoint
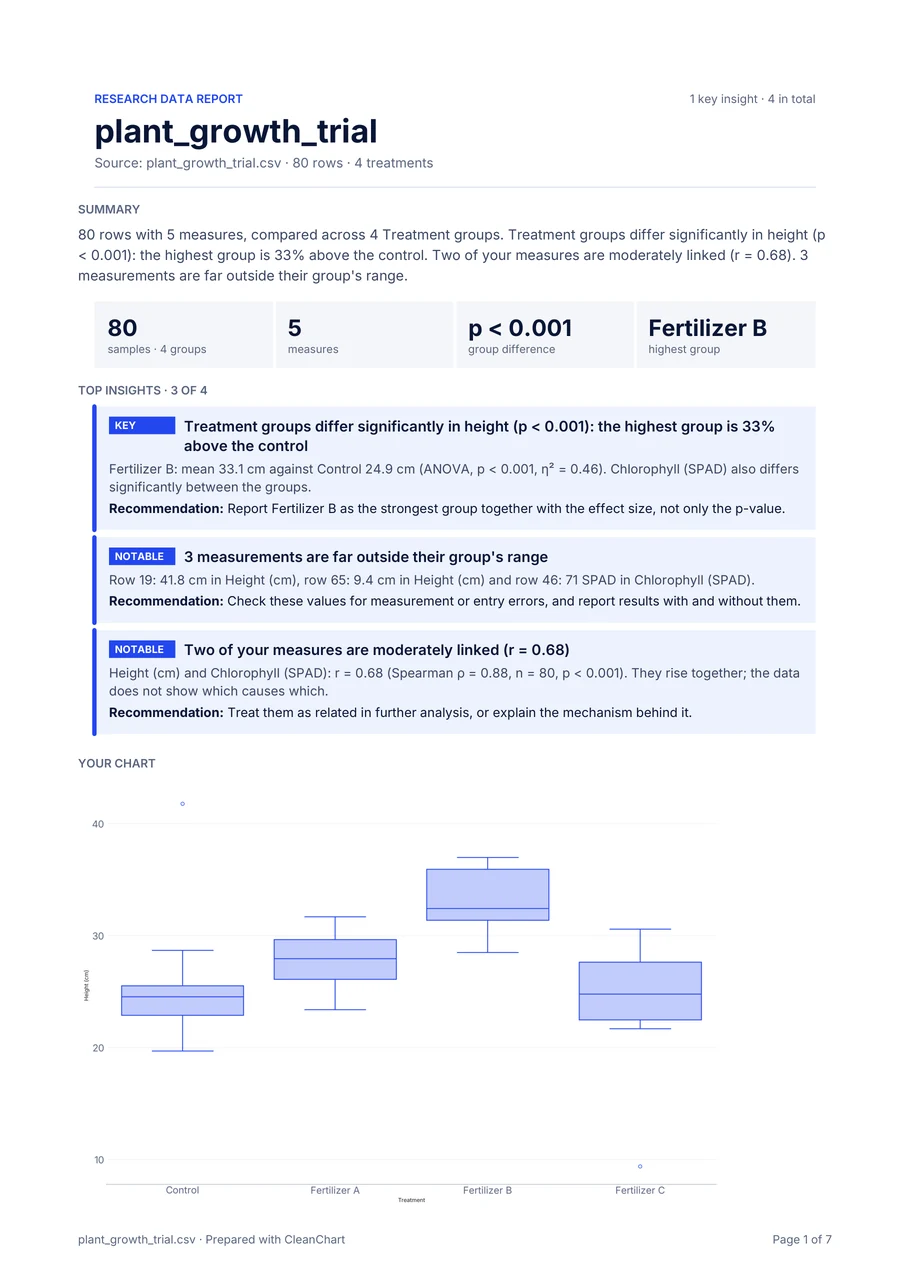
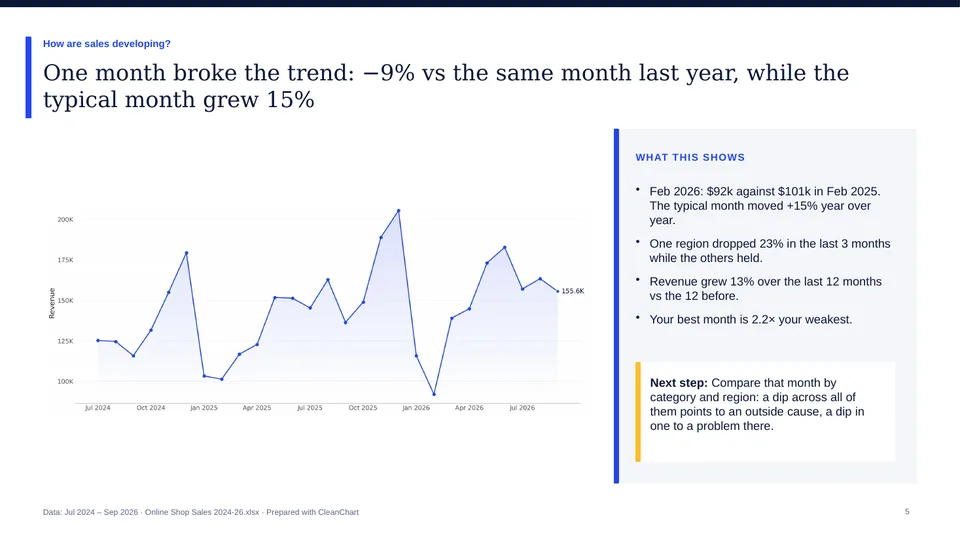
Not just one bubble chart. Several charts and findings from the same file, in a report and a deck.
Several charts, not one
Trends, breakdowns, distributions and relationships: the report draws the charts your columns support.
A written data report
Page 1 is a one-page brief with key figures and the top 3 findings, then every finding with a recommendation. As a PDF and an editable Word file.
A PowerPoint deck
One slide per chart with its main finding as the title, plus the summary and the recommendations. Text and tables stay editable.
Upload your file above: page 1 of the report is a free preview when the file has 10 to 20,000 rows and enough findings. The report and the deck are included in the Deadline Pass ($4.99) and Pro. Open a sample research data report
How to Convert TXT to Bubble Chart
Upload Your TXT Data
Drag and drop or click to upload your TXT file (up to 2 MB).
CleanChart Auto-Processes Your Data
We automatically detect your data structure, clean formatting issues, and prepare your data for visualization.
Select Bubble Chart
Choose Bubble Chart from our chart type options. The chart preview updates instantly as you make selections.
Customize & Download
Adjust colors, labels, and styling to match your needs. Export a free watermarked PNG, or a clean PNG, SVG or PDF on a paid plan, for presentations and reports.
Why Convert TXT to Bubble Chart?
Fast Analysis
Visualize patterns in your TXT data instantly instead of scanning rows of numbers. Bubble Charts make trends and outliers immediately visible.
Better Presentations
Professional Bubble Charts make your reports and presentations stand out. Transform raw TXT data into compelling visuals.
Easy Sharing
Export high-quality images ready for documents, slides, or social media. Share insights from your TXT data effortlessly.
No Technical Skills Required
Point-and-click interface means anyone can create beautiful Bubble Charts from TXT data. No coding or design expertise needed.
Sample TXT data for a Bubble Chart
X	Y	Size
10	20	5
15	35	12
20	28	8
Needs two numeric columns (X and Y) and a numeric size column. Upload a file laid out like this and CleanChart builds the Bubble Chart from it in seconds.
Columns a Bubble Chart needs
Match your columns to this layout for the best results. Download a starter file to get going fast.
Expected data layout
Needs two numeric columns (X and Y) and a numeric size column.
| X | Y | Size |
|---|---|---|
| 10 | 20 | 5 |
| 15 | 35 | 12 |
| 20 | 28 | 8 |
About TXT Data
TXT (Plain Text) files are the simplest and most universal data format. CleanChart imports .txt files containing tabular data with common delimiters — commas, tabs, semicolons, or pipes — and converts them into charts instantly. The parser auto-detects the delimiter and handles quoted fields, making it easy to chart data from any text-based source.
Plain text files are produced by command-line tools, log processors, database exports, and legacy systems that predate modern formats like CSV or JSON. If your data pipeline outputs .txt files, or you have tab-delimited exports from older applications, you can upload them directly to CleanChart without renaming or converting. The importer treats .txt files the same as CSV or TSV, applying intelligent delimiter detection.
TXT Advantages:
- Universal format — works on every platform
- Auto-detects delimiters (comma, tab, semicolon, pipe)
- No conversion or renaming needed
- Compatible with command-line tool output
- Handles legacy system exports
Learn more about data formats: CSV specification, JSON.org, Microsoft Excel Help.
About Bubble Charts
Compare three variables with bubbles of different sizes. Bubble Charts are perfect for:
- Market opportunity analysis
- Company valuation visualization
- Population vs income analysis
- Product positioning analysis
Helpful Guides & Resources
Frequently Asked Questions
Is it really free to convert TXT to Bubble Chart?
Yes! CleanChart offers a free tier with chart creation capabilities. Premium features are available for advanced customization needs.
How large can my TXT file be?
Uploads can be up to 2 MB, which is typically thousands of rows. For very large datasets, consider filtering or aggregating data first.
What happens to my data?
Your data is processed securely. We don't store it longer than necessary for chart creation. See our privacy policy for complete details.
Can I edit the Bubble Chart after creating it?
Yes! You can customize colors, labels, fonts, and more before downloading. Make changes and see them update in real-time.
Can I convert TXT to other chart types?
Absolutely! The same TXT data can generate bar charts, line charts, pie charts, and many more. Explore all 29 chart types.
Related Converters
Other TXT Converters:
Create Bubble Charts From:
Ready to Convert Your TXT Data?
Start creating professional Bubble Charts in seconds — no coding required.
Upload Your TXT File Now